A Case Study by Ade Hanft
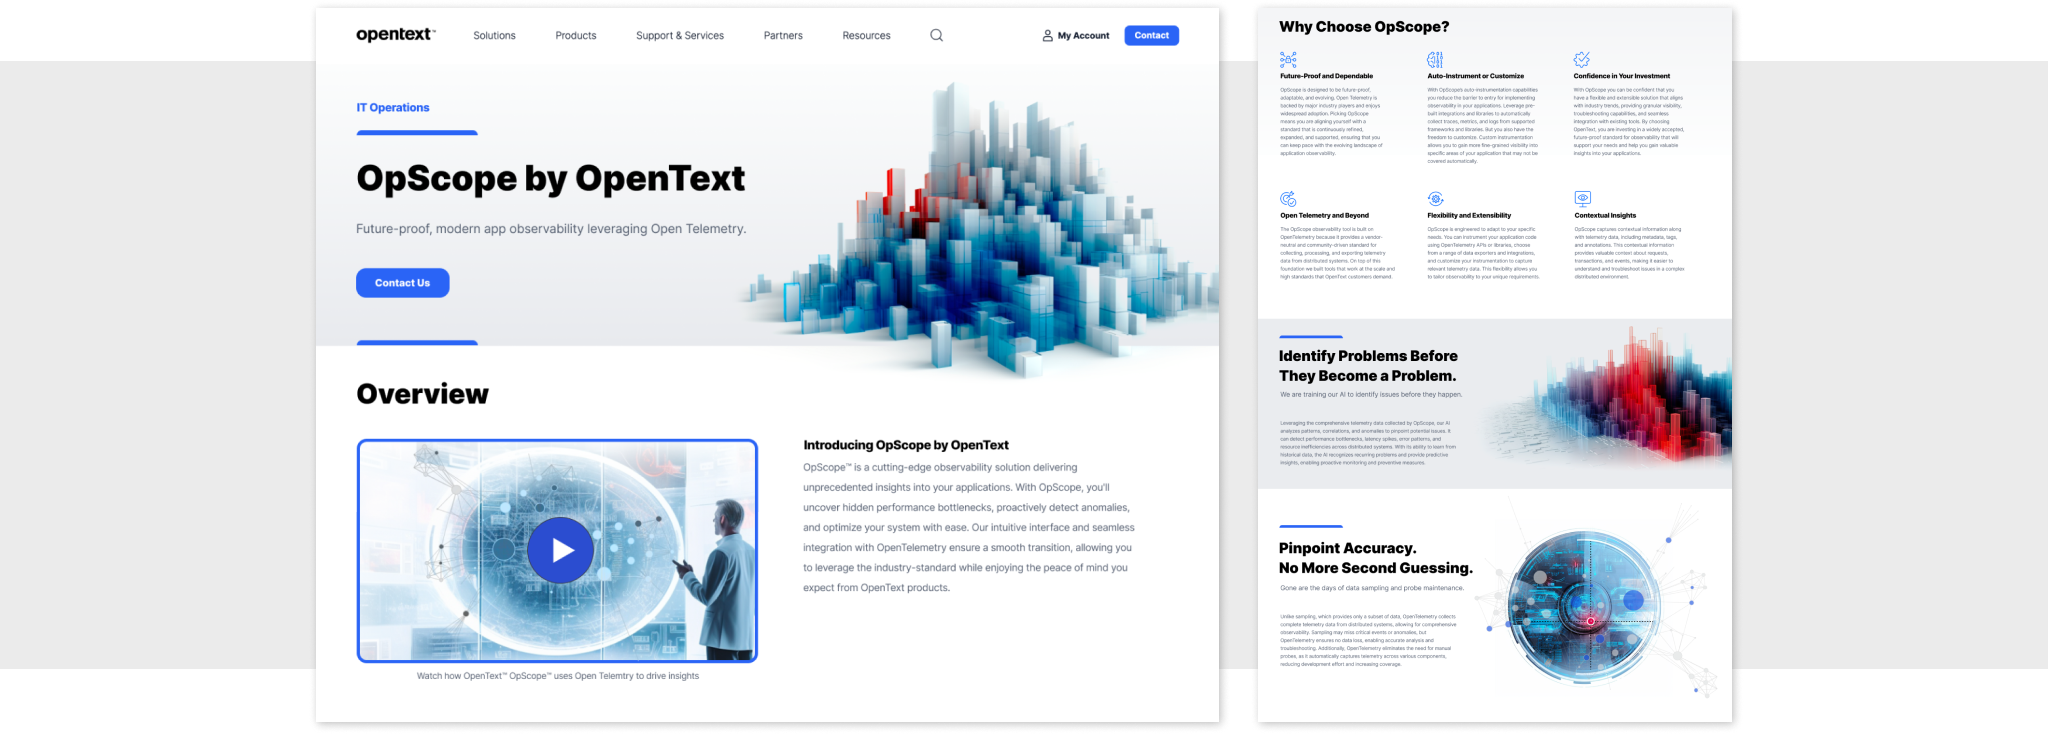
I joined OpenText in November, 2022 as the lead UX Designer for a new product called OpScope. The idea was to create a lightweight monitoring tool that IT professionals could use to monitor the health and performance of their company's applications and infrastructure. OpScope is different from previous OpenText products because it leverages an emerging technology called Open Telemetry.
In this case study I will highlight my role in this project as we went from whiteboards to launch. I will focus on 3 areas:
- User Research
- Product Design
- Driving Innovation
Part 1: User Research
Understanding the people who will use OpScope
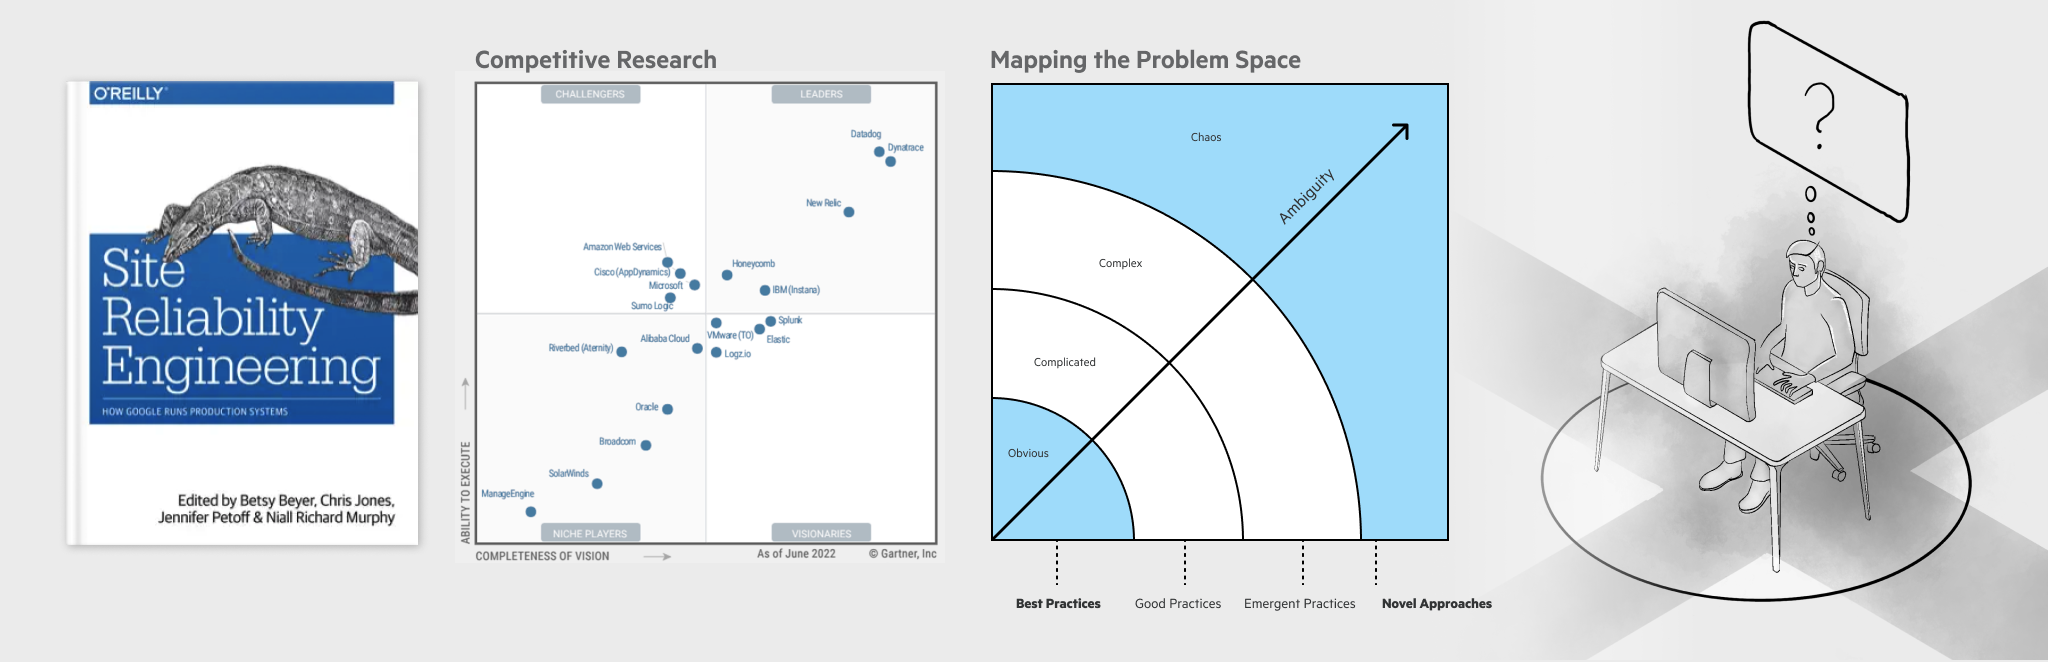
When starting this project, my first task was to better understand the domain I was entering. Although I have worked with many developers over the years, I didn't fully understand how professionals in the IT industry troubleshoot application and infrastructure problems. Much of my initial research involved familiarizing myself with Site Reliability Engineering (SRE) to understand the tools, methodologies, and competition in the IT troubleshooting space. As I mapped the problem space, I could see that current best practices were no longer adequate to address the increasingly ambiguous and chaotic nature of modern application problems. To over-simply, today's engineers work in systems where anything can go wrong for any unpredictable reason. This was an important observation because it meant that our design solution would require a novel approach rather than a re-skinning of existing IT tools. The goal was to create a tool that supported new forms of complex problem solving.
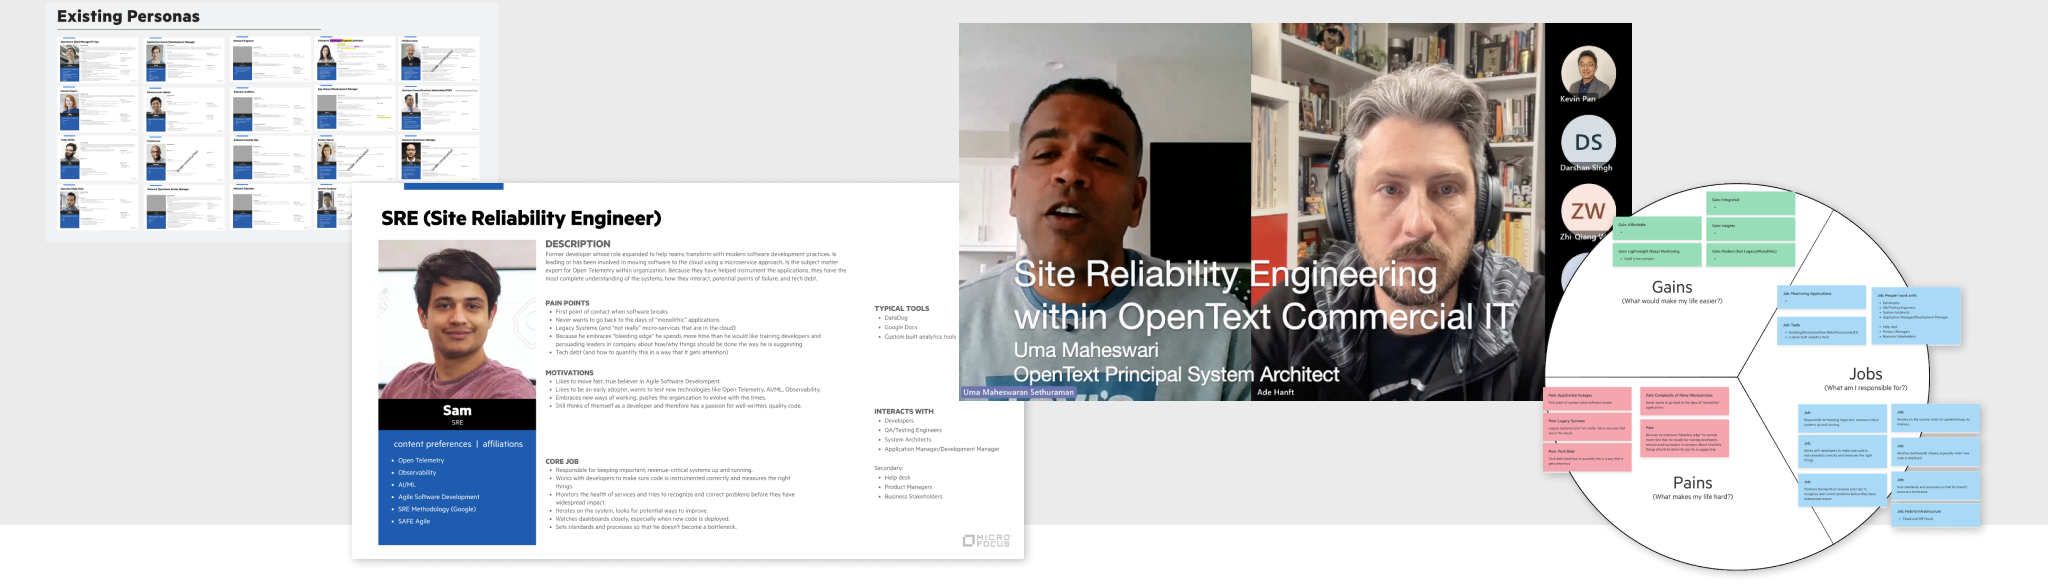
With a basic understanding of the DevOps domain, I sought out people in the industry to talk to so that I could understand the SRE persona better. OpenText already had an assortment of user personas but they were mostly based on legacy patterns of IT management. Because OpScope was focusing on an emerging technology (Open Telemetry) it was important to create a new persona based on where the industry was going. This persona is called a Site Reliability Engineer (SRE). I created a living document that loosely described the SRE persona and then began a user study where I talked to a dozen SREs. I used empathy mapping techniques to document the jobs of SREs, collected a list of pain points, and highlighted the gains that would benefit our users.
As our product started to take shape I continued to look for opportunities to talk to our users. In October 2023 I conducted a usability study at OpenText World, our annual global company event. Because so many people attend OpenText World, our UX team is able to conduct over 100 usability tests over the course of two days. These moderated tests are scripted, data is carefully collected, and the results are formally presented to the product teams after the event. I've done usability testing in the past on a smaller scale, but this was the largest and most organized research project I have been a part of.
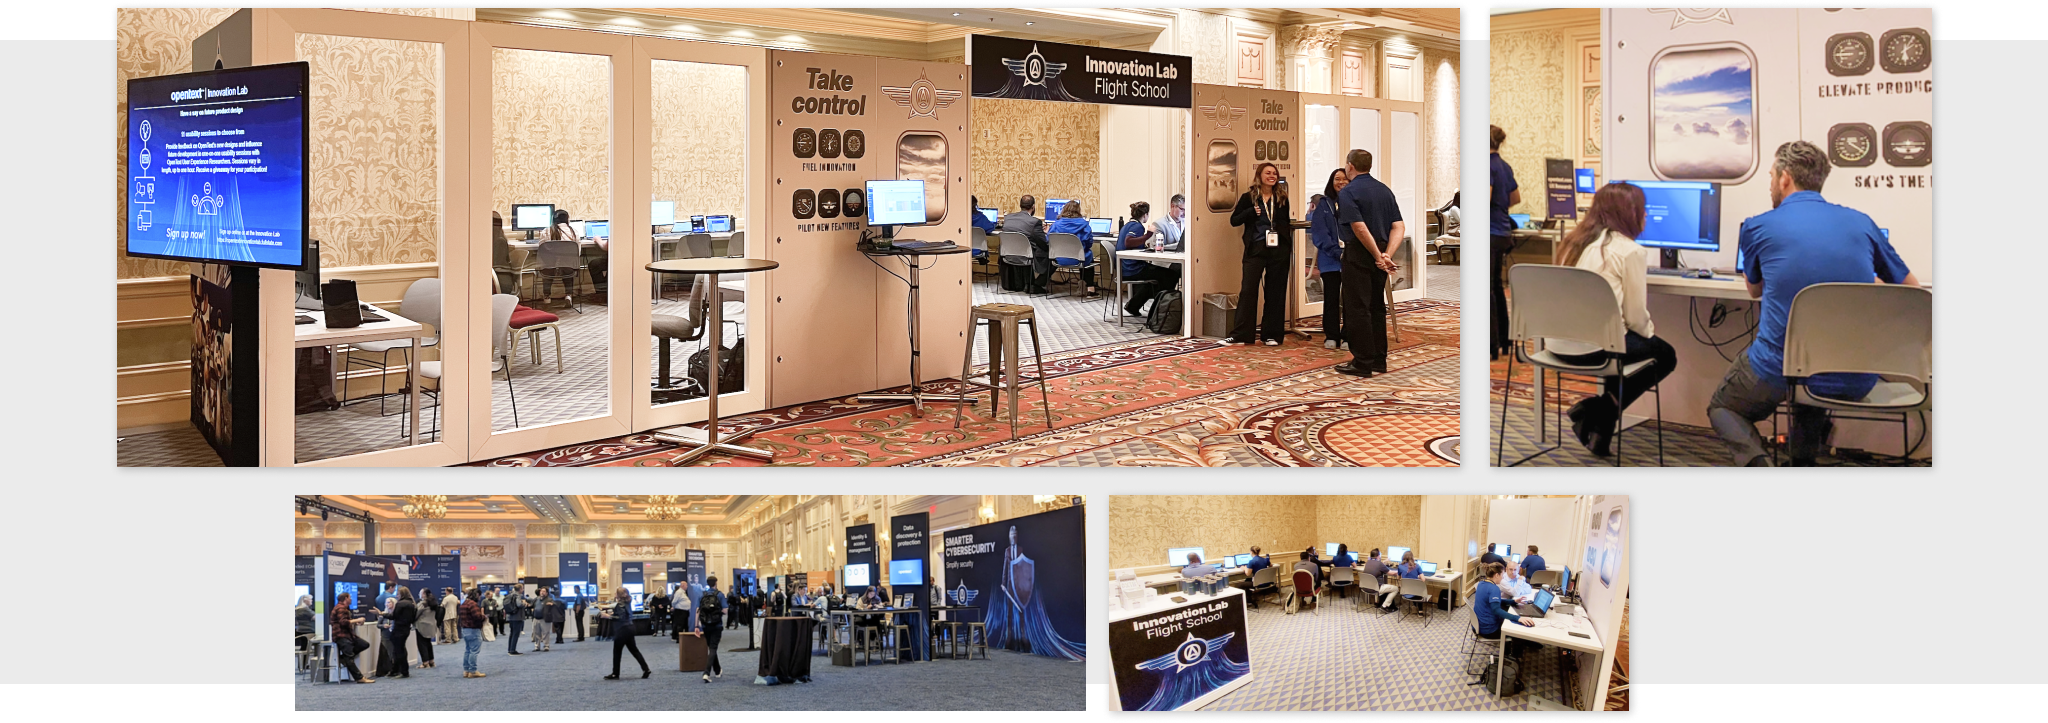
My testing at OpenText World identified several areas where users struggled with our product. For example, the discoverability of one of our main screens was suffering due to an obscure icon placed oddly in the UI. This was a known UX issue, but it was only after I demonstrated that 100% of users failed to find the screen that our UX fix could be prioritized. Armed with data and stories from the users I returned home to present my findings to our teams and stakeholders. My recommendations were discussed, stories were created, and fixes were implemented.
Next I want to describe my approach to the product design of OpScope.
Part 2: Product Design
From Prototype to Wireframes, to Prototype, to Launch
One of my first tasks in designing OpScope was to identify the key workflows that our application needed to support. To do this, I used Miro and Figma to map out the primary tasks that users would perform. These workflows were created in collaboration with my product management counterparts. Together we identified "troubleshooting" as the first workflow we wanted to support. In short, "When something goes wrong, how do I diagnose the problem so that I can fix it?" The image below shows some of the artifcats of taking the product from workflow diagrams to sketches to prototypes.
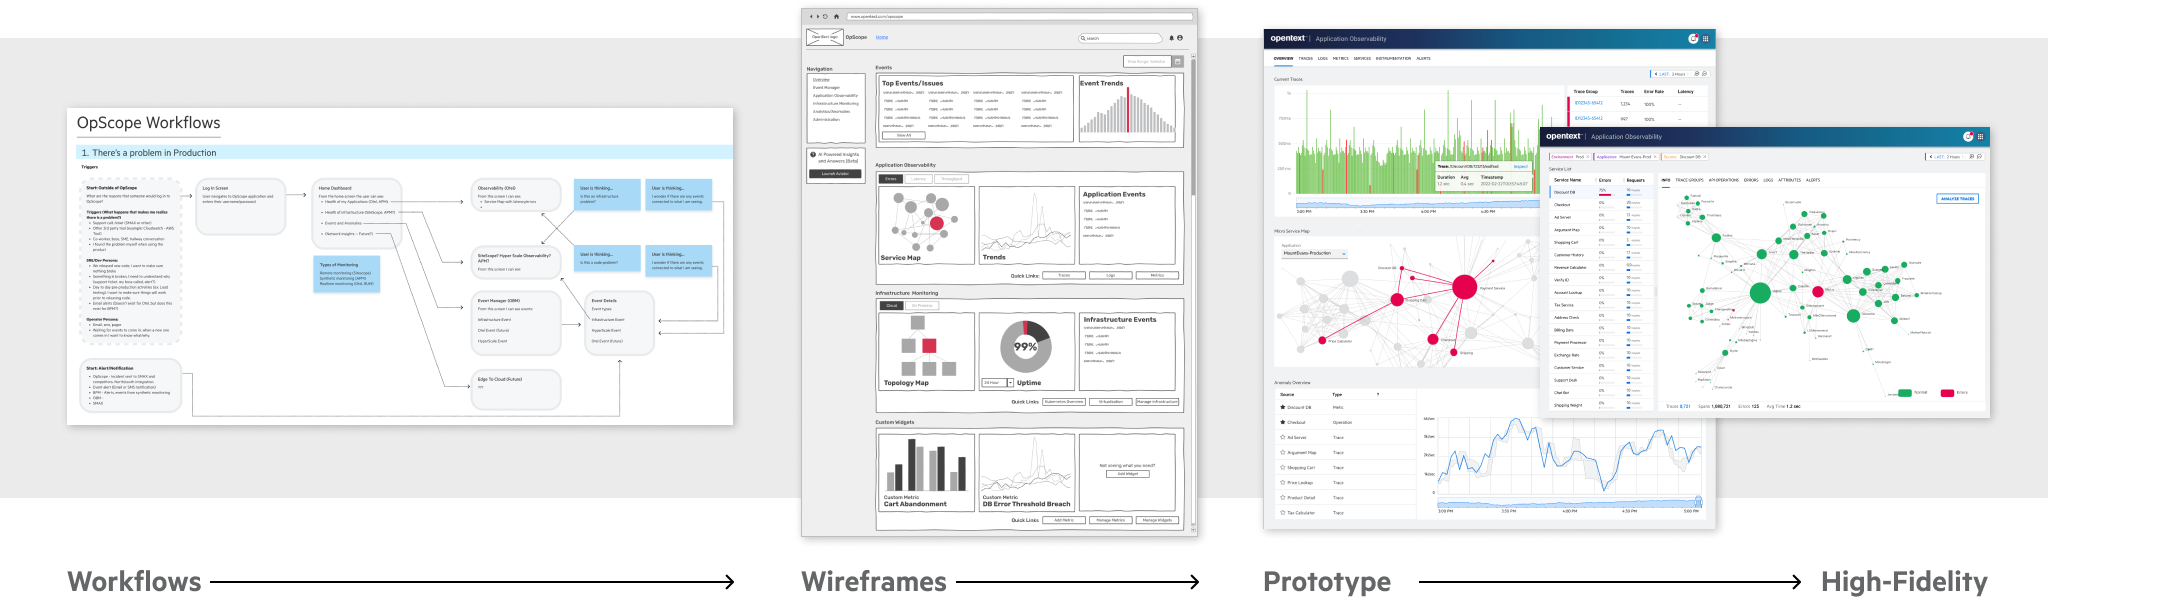
I believe it is important to start at low fidelty. By quickly sketching wireframes in Figma I am able to refine ideas and get alignment between my partners in Product and Engineering. Once the OpScope wireframes were developed to a point where we felt they were ready to be validated with users, I showed them to the IT professionals in our office to confirm that we were indeed on the right track.
With validated wireframes, I then moved into the prototype phase where I used Figma to build interactive prototypes. The prototypes were used to get feedback from customers. We met regularly with customers who signed up to be "design partners" and revised our designs based on their feedback. With each iteration of the prototype, the designs were refined and improved. I already mentioned my collaboration with product managers, but throughout this phase of the product design I was also working in collaboration with our engineering leaders. This is important because it allowed our developers to begin working on the product before designs were completely finalized. In the spirit of agile development, we embrace collaboration over waiting for official approval before starting development.
I mentioned earlier that a goal of OpScope was to enable complex problem solving. To support this concept I explored different ways to represent information through data visualizations. Behind the scenes, modern software products can have hundreds of microservices communicating with each other. This isn't a static system, it is more like a constantly changing living organism. When a problem occurs it is difficult to pinpoint what is causing the issue. Below are some of my explorations around different ways to visualize the system data.
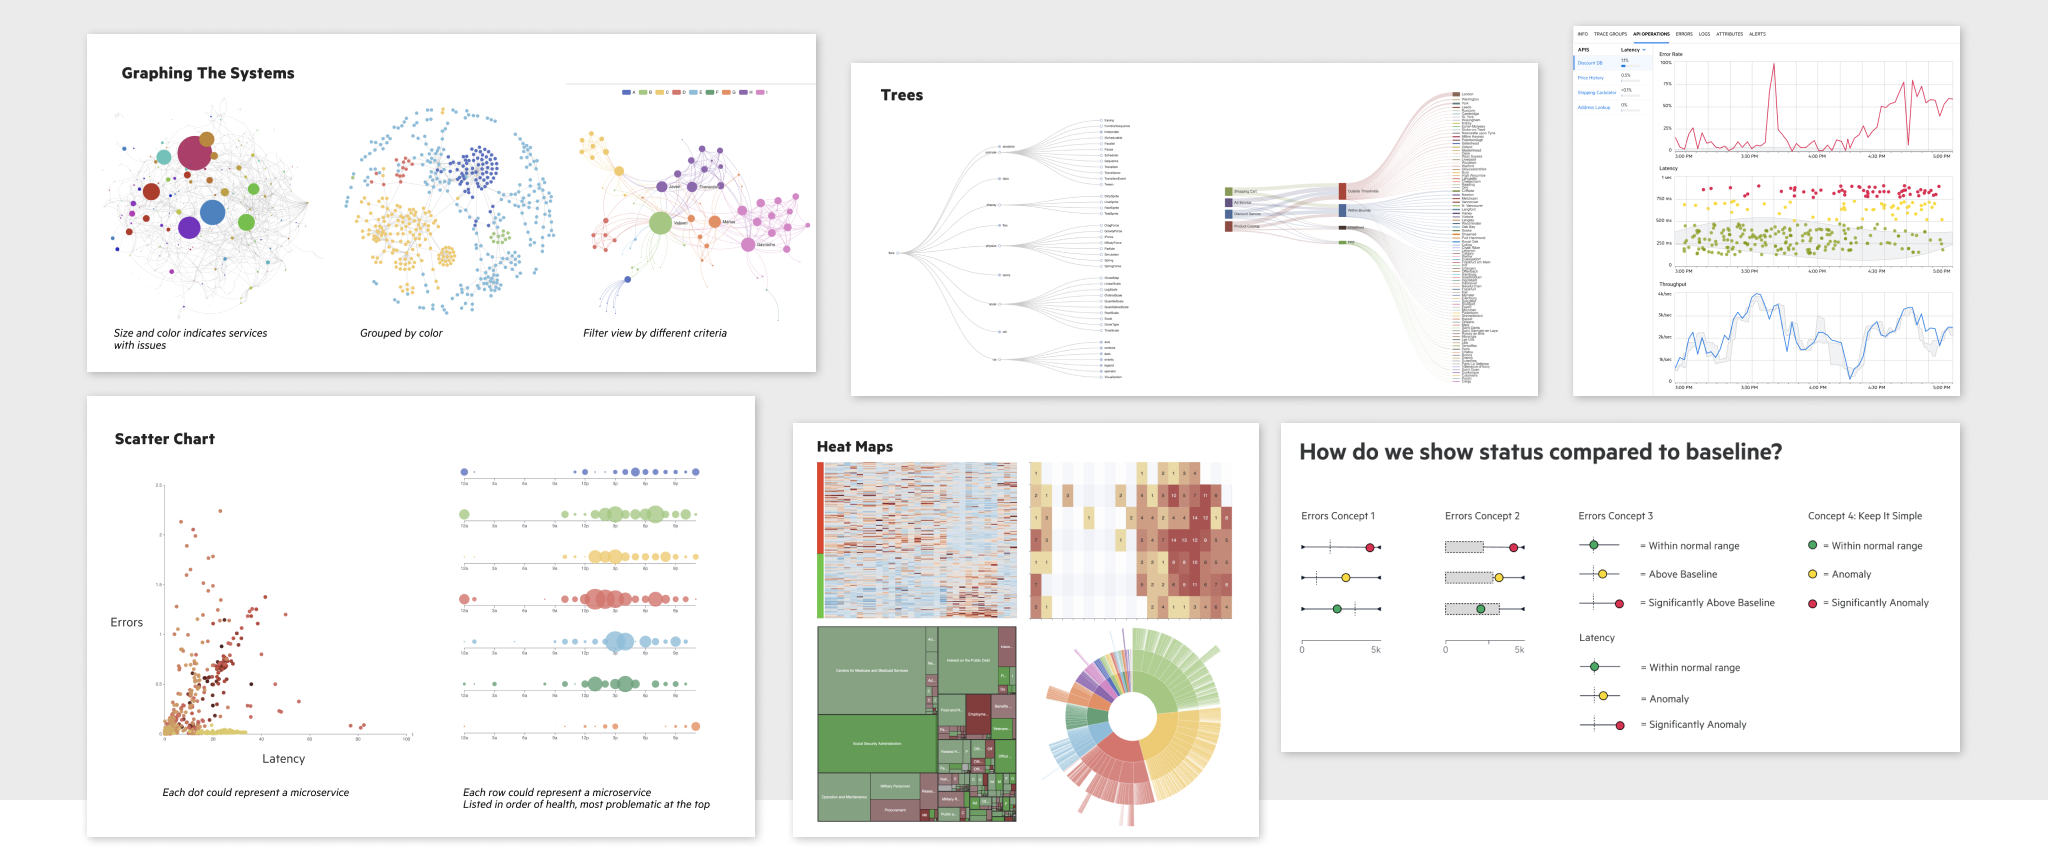
Creating novel data visualizations is a heavy engineering task. When going beyond standard line graphs and bar charts, you quickly hit the limits of off-the-shelf charting libraries such as highcharts or echarts. We used D3, a library that although it comes with a steep learning curve, it allowed our developers to support the types of data visualizations that would set our product apart from the competition.
OpenText is a large corporation with hundreds of products. Our corporate design system allows us to maintain consistency across our products while also supporting the flexibility required by unique use cases. As a member of a team of 100+ UX designers around the world, I work within the pre-defined system but also look for opportunities to contribute to our design system to make it better. I wanted our application to support dark mode, a feature that I often heard customers requesting. The designs below are artifacts demonstring how OpScope would look in dark mode and some of the rationale I used to get this feature added to our design system.
It was important that the user could navigate from the main screen down to the place where problems were occurring in their applications.
Our product has launched with a core set of functionality and the next step is to expand to more advanced use cases and workflows. Next, I will conclude this case study by describing how our product is designed to evolve in future iterations.
Part 3: Driving Innovation
Designing for a future of AI/ML, VR, and 3D
Finally, I want to show how the first versions of OpScope are driving towards innovation in future releases. When launching a new product it can be challenging to design the first release while maintaining an eye on the future.
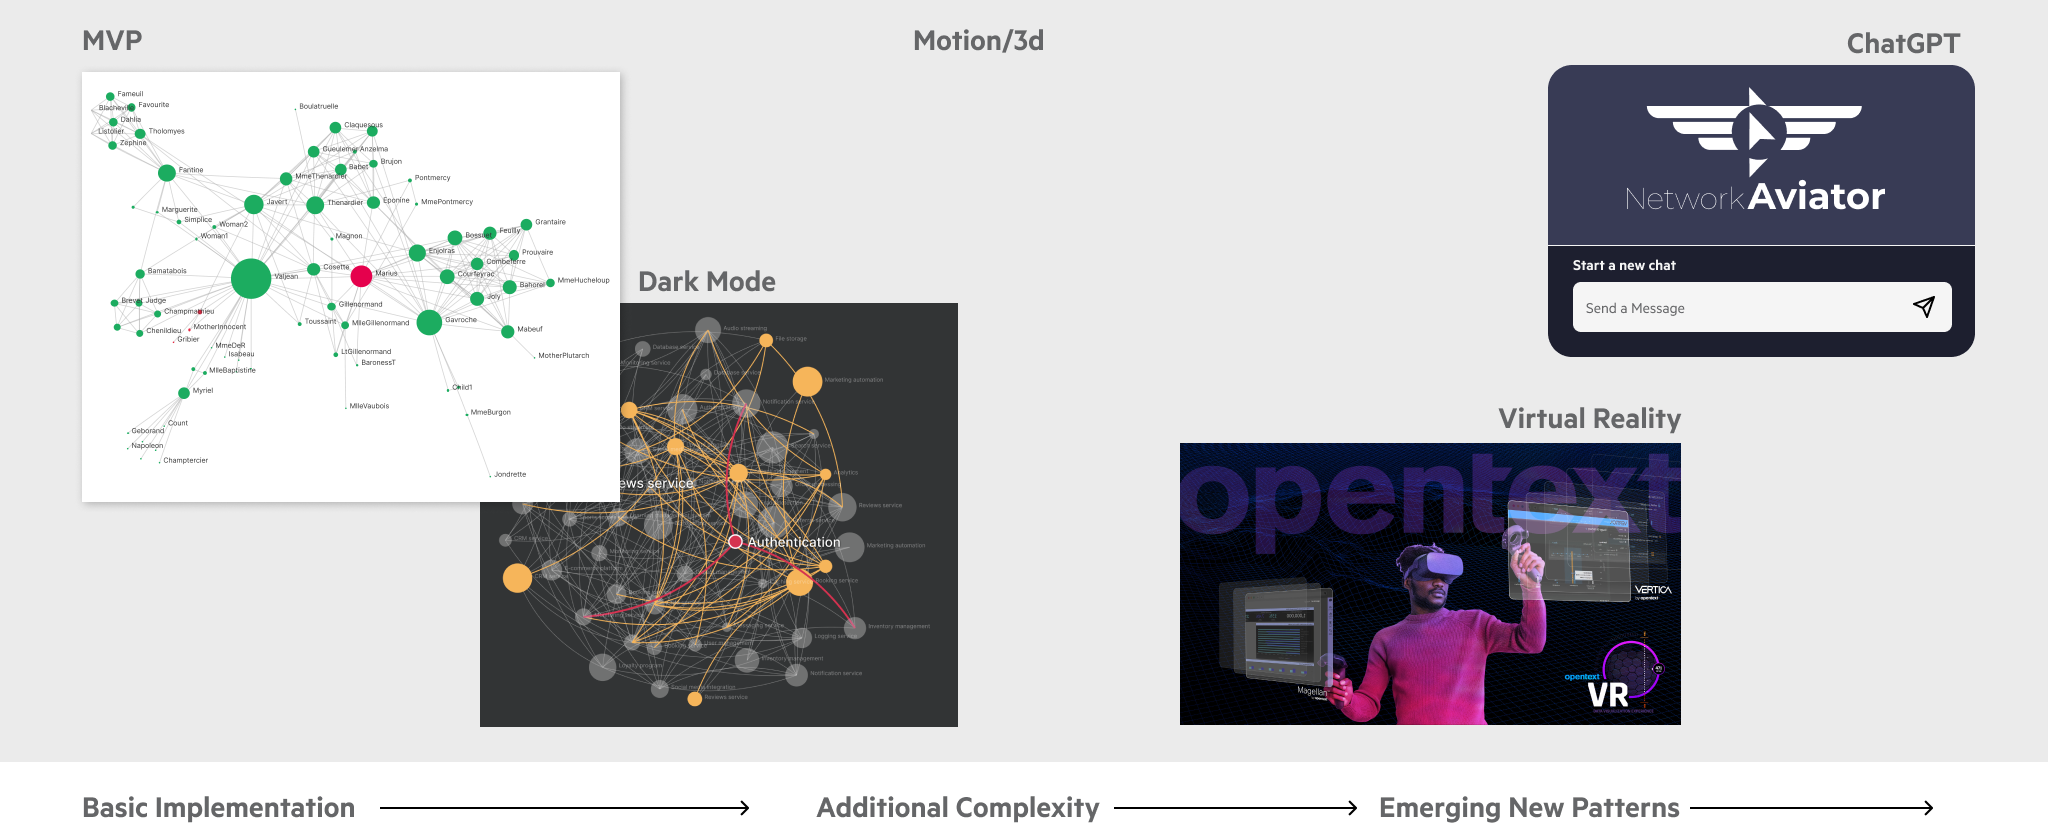
As part of an internal hackathon week, our team imagined what our product would look like as a VR app. We transformed our flat, 2D graphs into immersive 3d environments where users could walk inside their data as if it were a galaxy of stars. By changing attributes in the data we noticed that the data constellations clustered in interesting ways, allowing to users to see relationships that wouldn't be possible in traditional 2d graphs. While we may never ship a VR app, this exercise let us look at our product from a novel perspective.
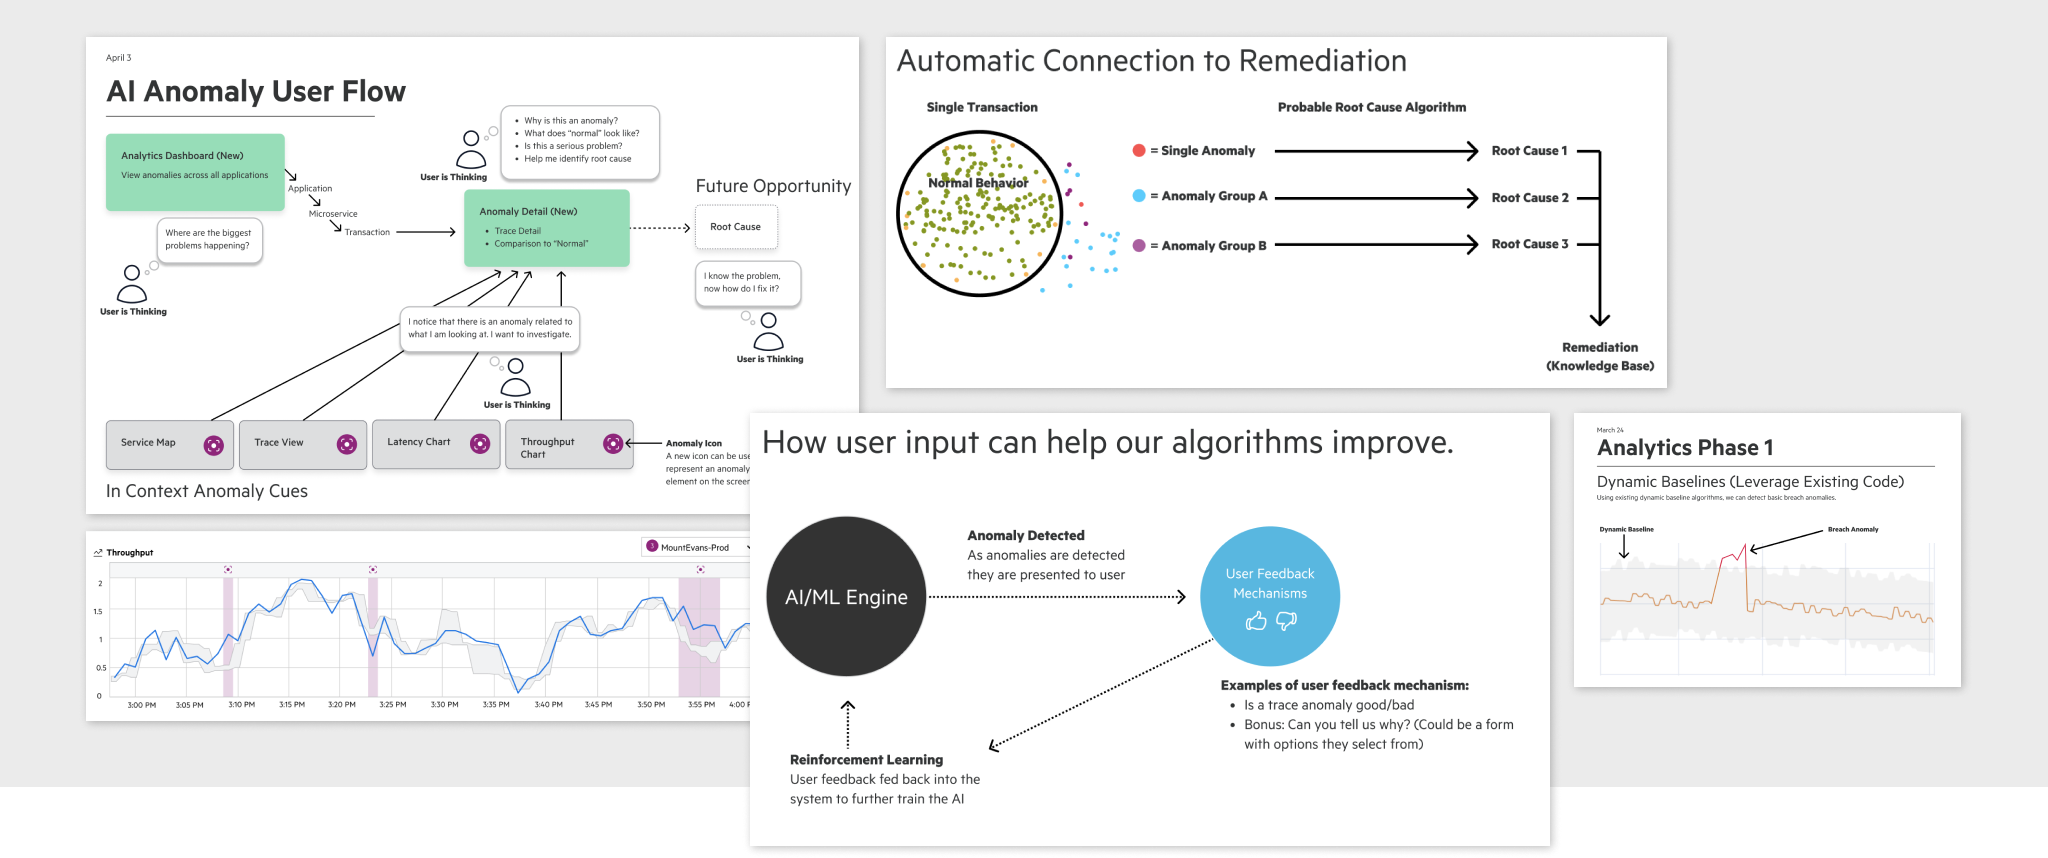
Like so many companies, OpenText is embracing artificial intelligence and working to leverage machine learning and large language models in our products. Sometimes lost among the excitement of AI/ML potential is the UX challenges that these new technologies present. As I work with our data scientists I find myself talking about trust as the primary driver of good UX in products that leverage AI/ML/LLMs. For example, ML can be used to detect anomalies but when that anomaly is presented to a user, how will that person be able to understand why it is anomalous? Often the reason is opaque because the algorithms that flagged it are based on models that aren't easily parsed into human language. The user ends up having to fact-check the AI/ML because the user can't trust the results yet. There are similar UX challenges with the ChatGPT implementations. I've found that there is real skepticism with users as they are chatting with an AI. The promise of AI/ML/LLMs is that they will reduce the work of humans but if we aren't careful we will actually increase the work of users because now they have to fact-check and babysit a not-yet-fully-developed AI. This is an unsolved problem, and a UX opportunity that I look forward to solving as AI changes our world.
Conclusion
Thanks for taking the time to read this case study. If you have questions or feedback for me I invite you to contact me.