January 21, 2019
Why is the Boston Marathon So Slow?
Boston Marathon Data Analysis, Part 2
This is my second story in a new series focusing on the Boston Marathon. If you missed it, you can read part 1 here. This is a bit of a departure from my normal themes of design and creativity, but if you look closely those ideas will still probably break through at points. Let’s get to it…
The perception is that the Boston Marathon is a fast race. True, the winners always post blazing fast times, but what about everyone else? It might surprise you to learn that that the majority of Boston participants perform far below their capabilities.
Before I reveal the data I want you to guess what percentage of runners you think hit their qualifying time on race day. Remember, everyone had to beat their qualifying time by 3:23 just to get accepted into the race. So what’s your guess? Let’s dig into the data to find the answer.
I ended Part 1 with a question and a graph. The graph was the image below showing the distribution of runners in the 2018 Boston Marathon. My question was why are there so many dots on the right side of the 4 hour mark?
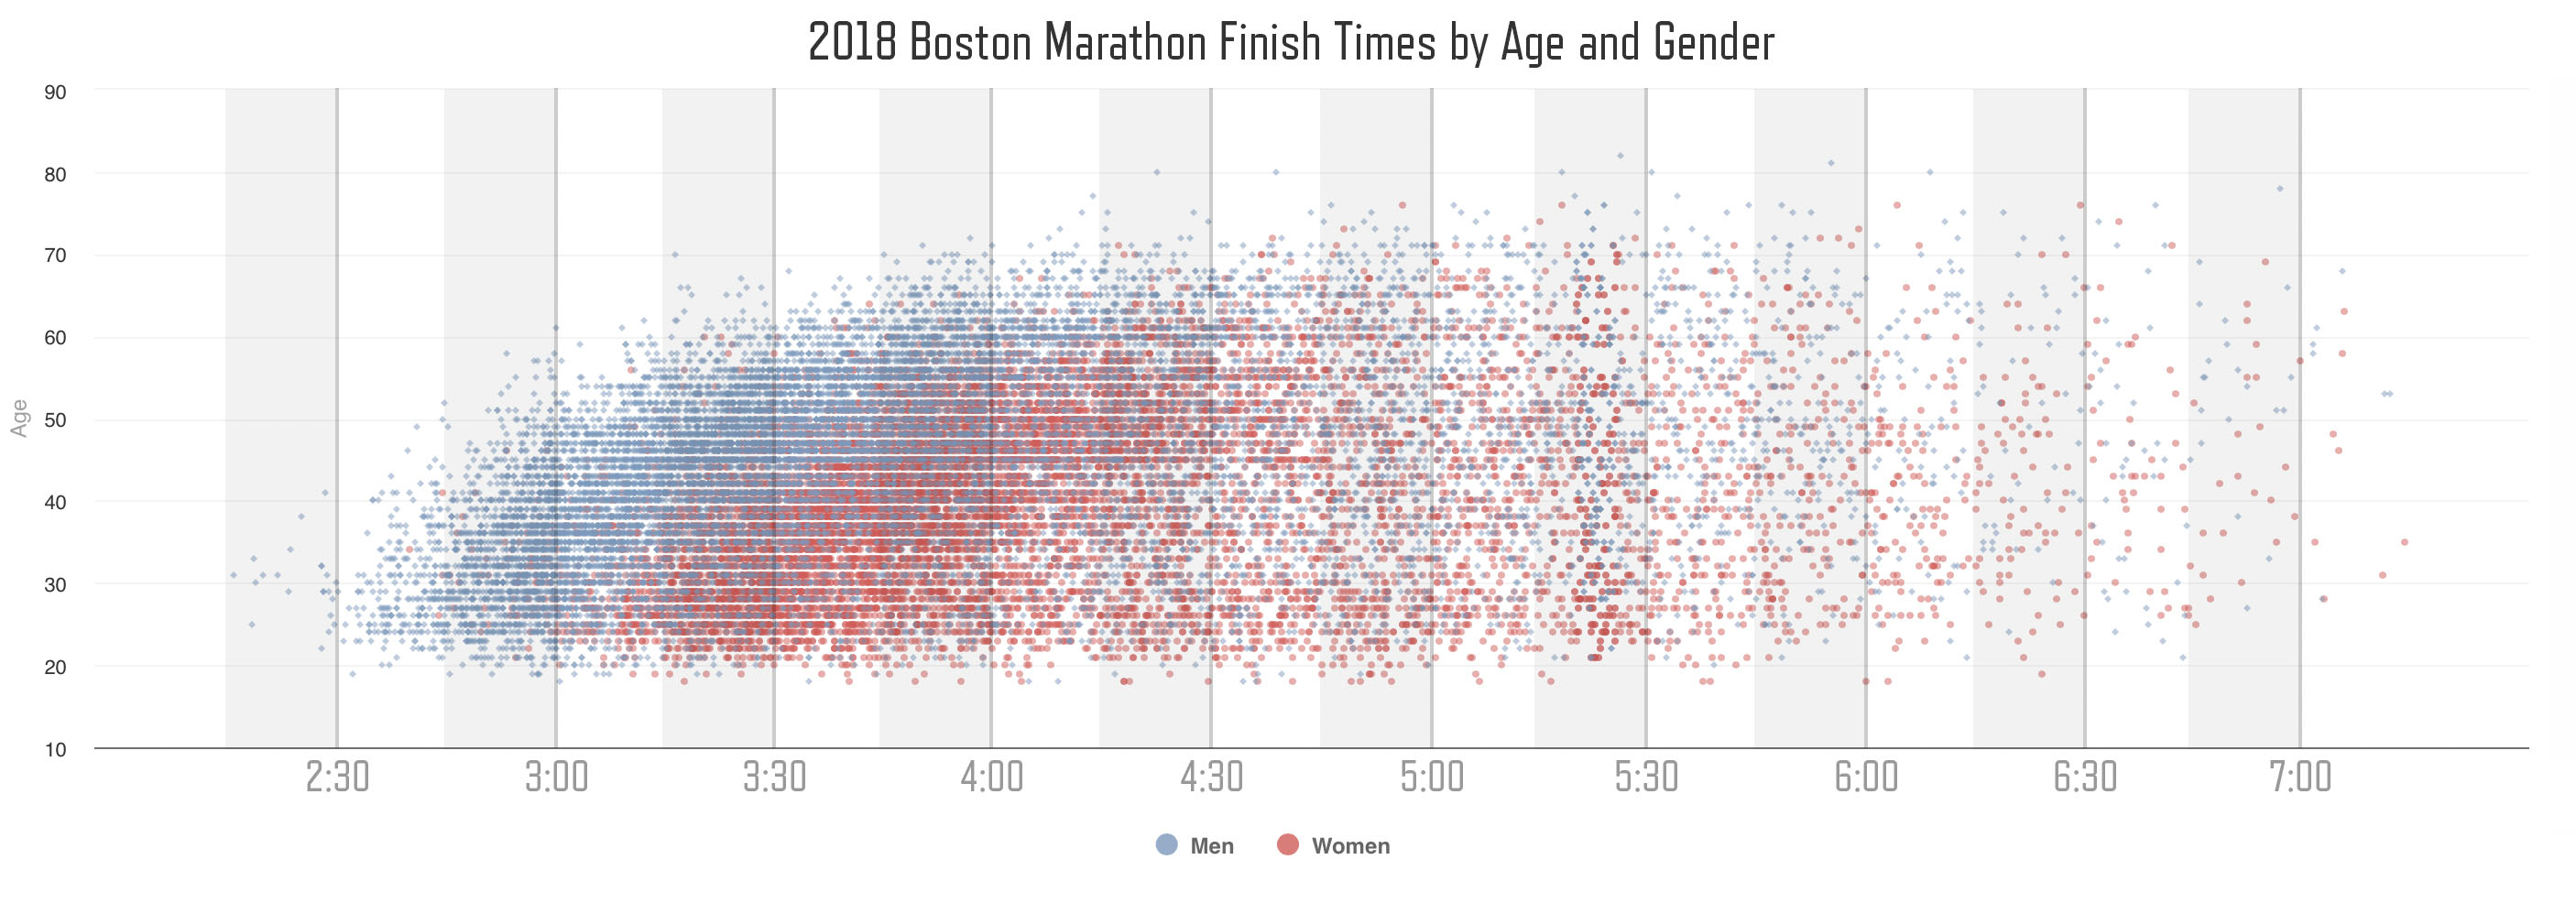
My hypothesis was that there are way too many dots on the right side of the 4 hour line than you would expect based on the times required to be admitted into the race. The average finish time of the Boston Marathon is about 3:45 for men and 4:05 for women.
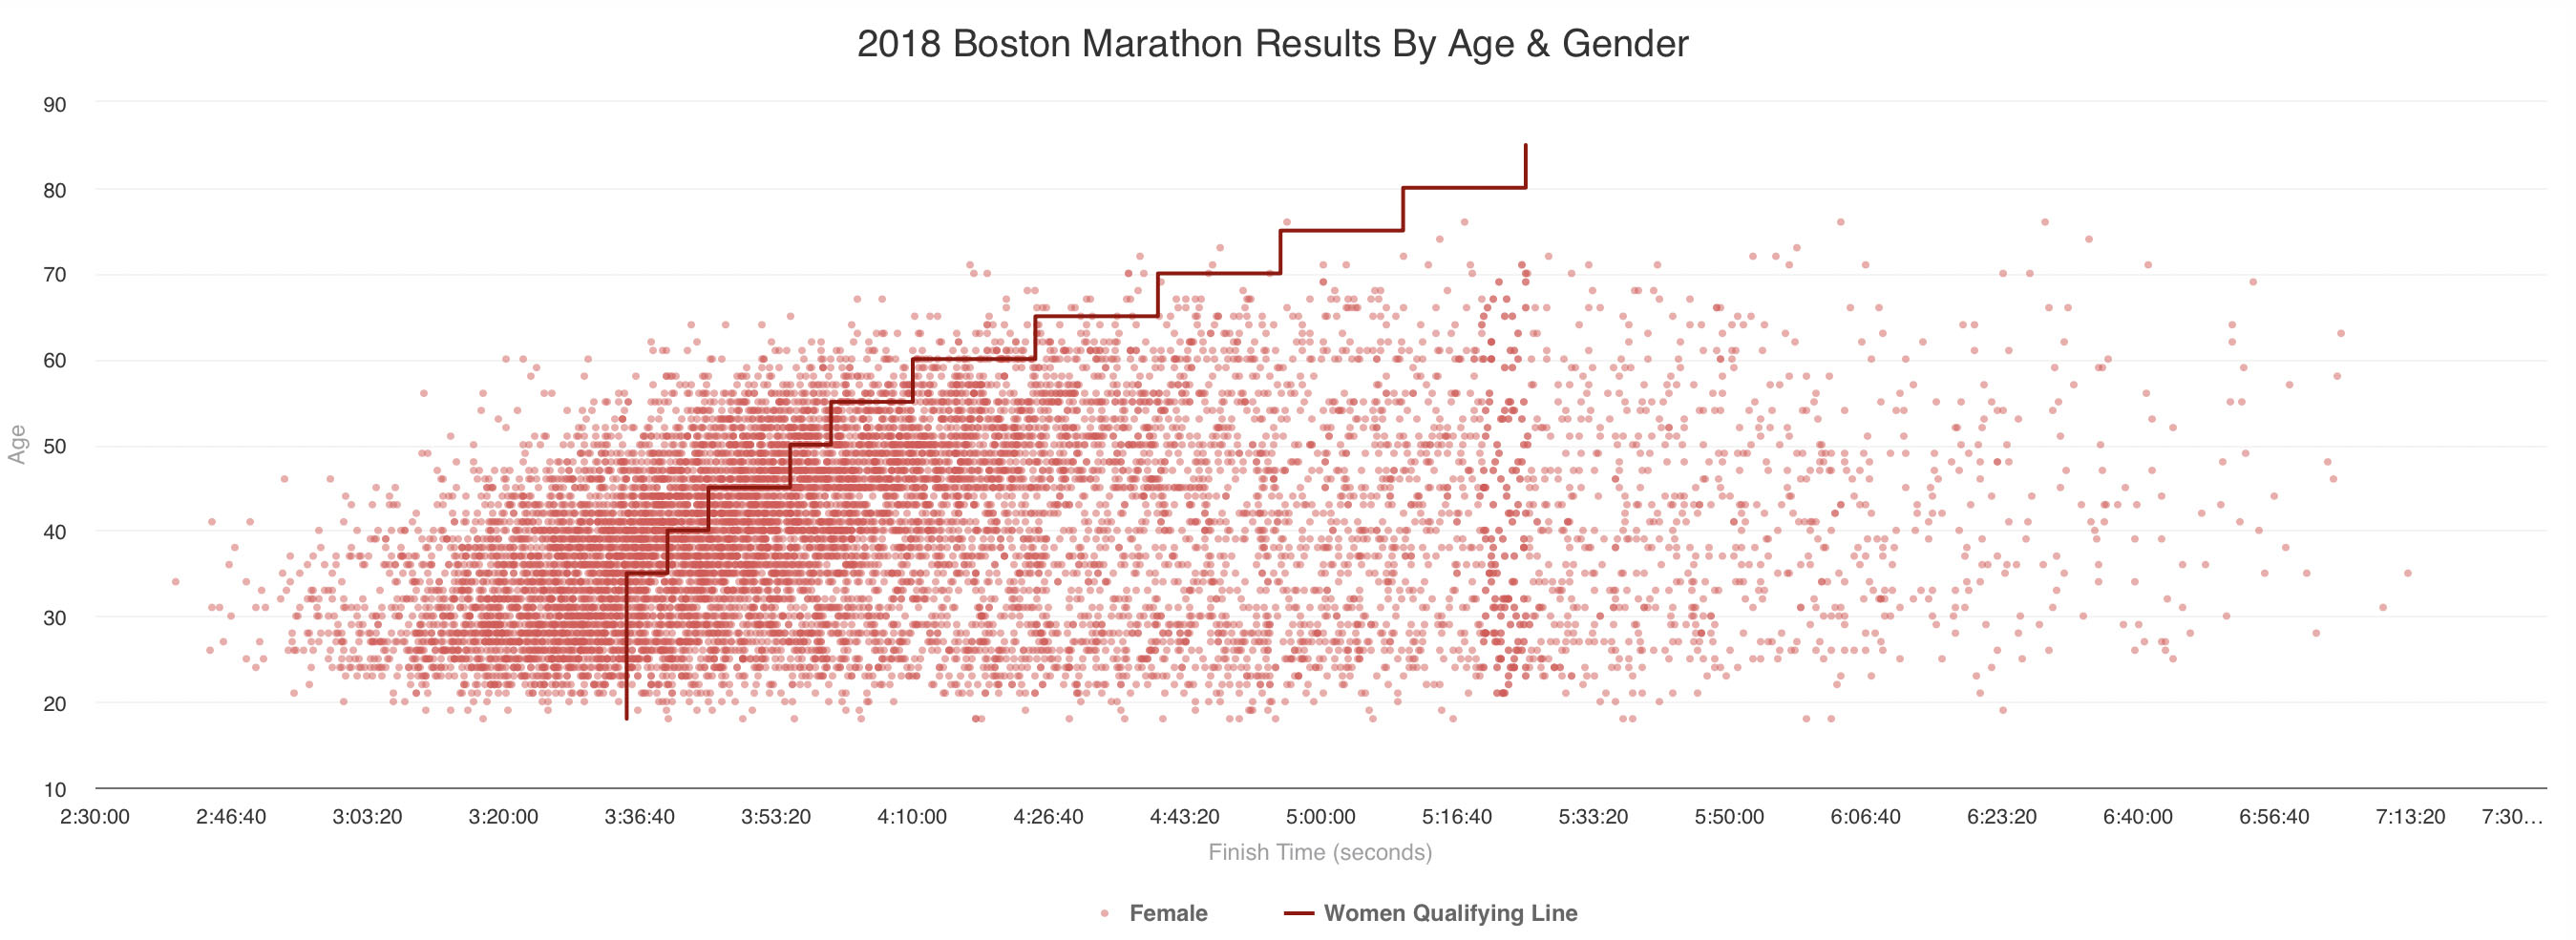
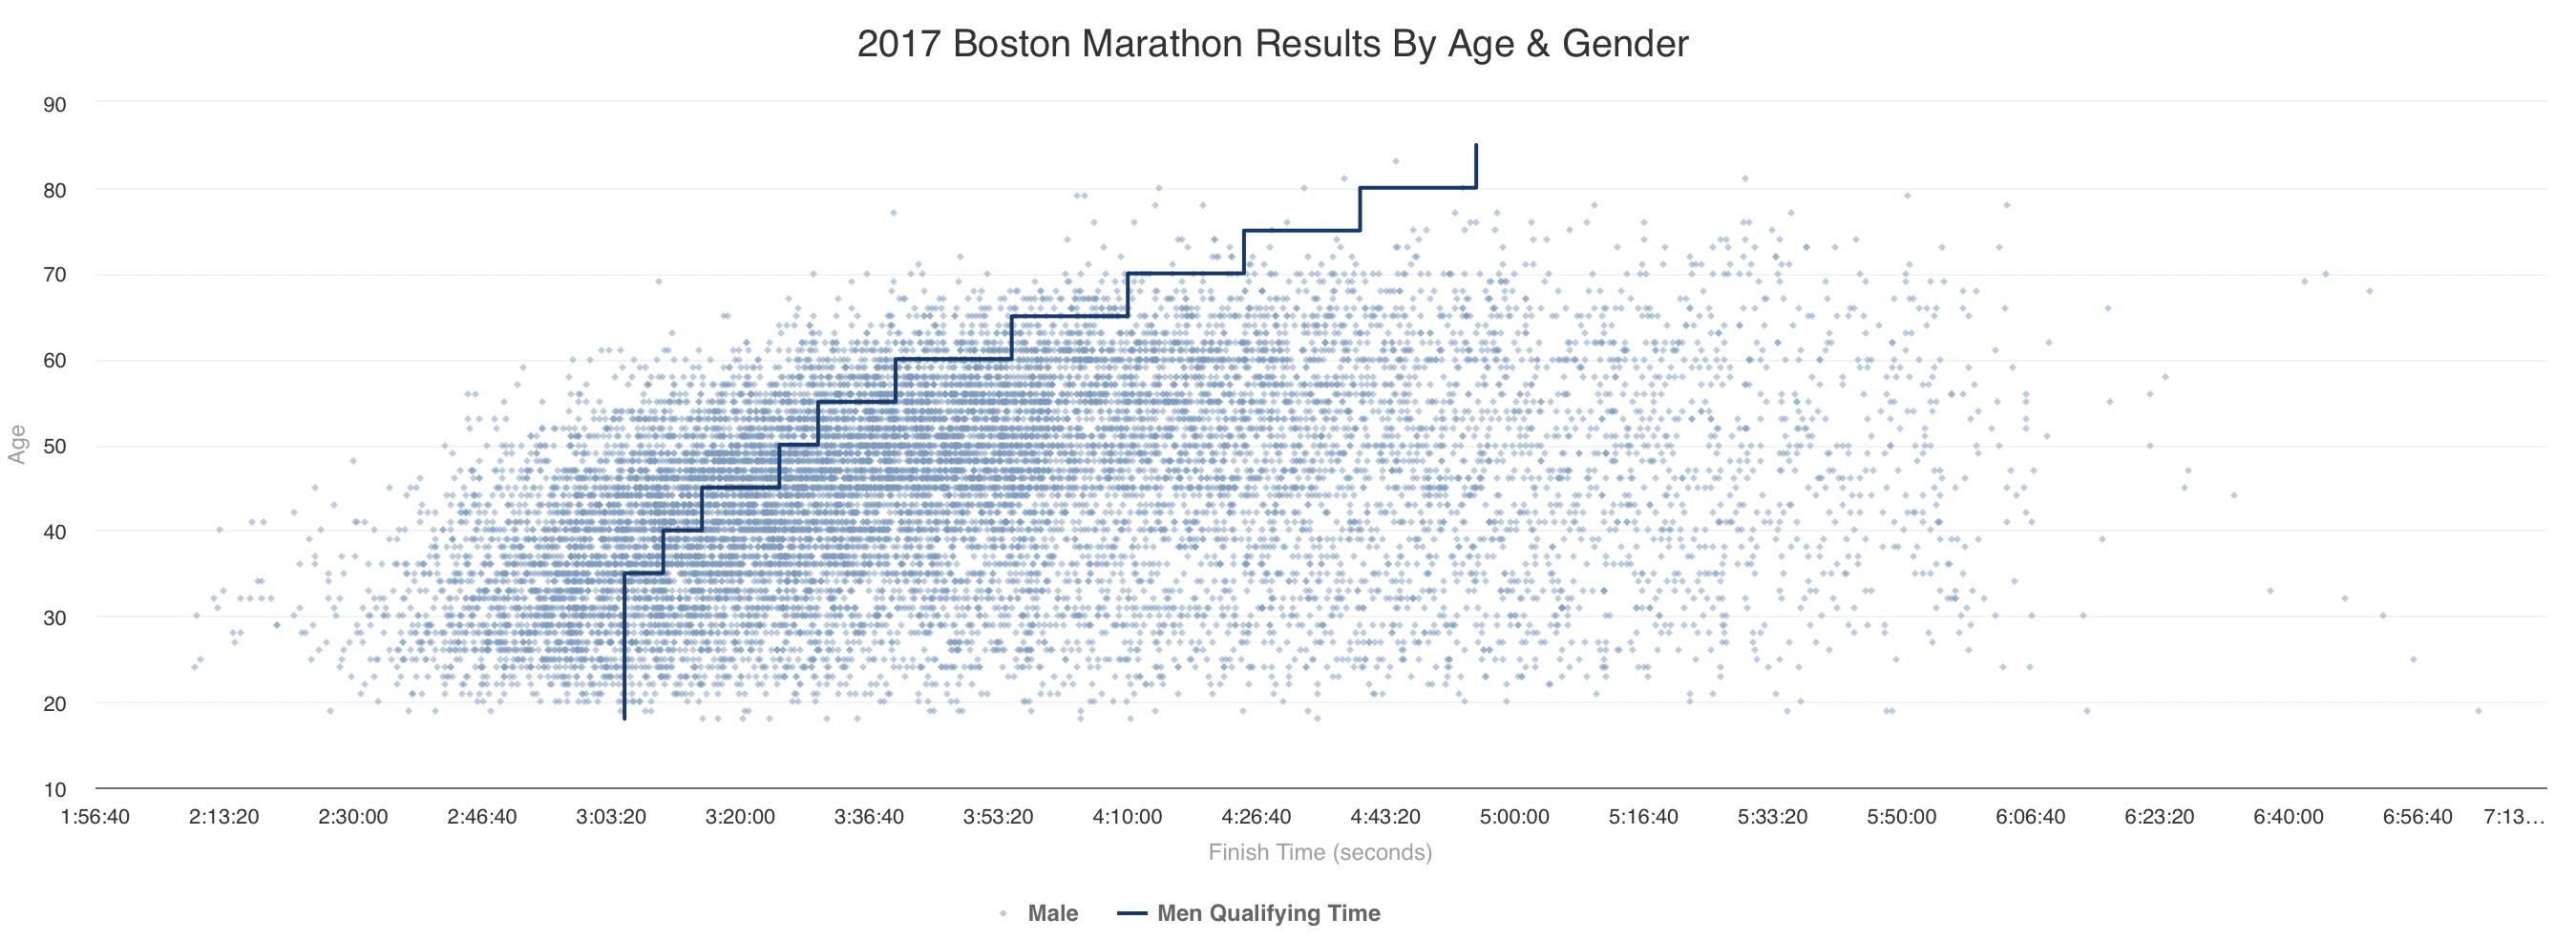
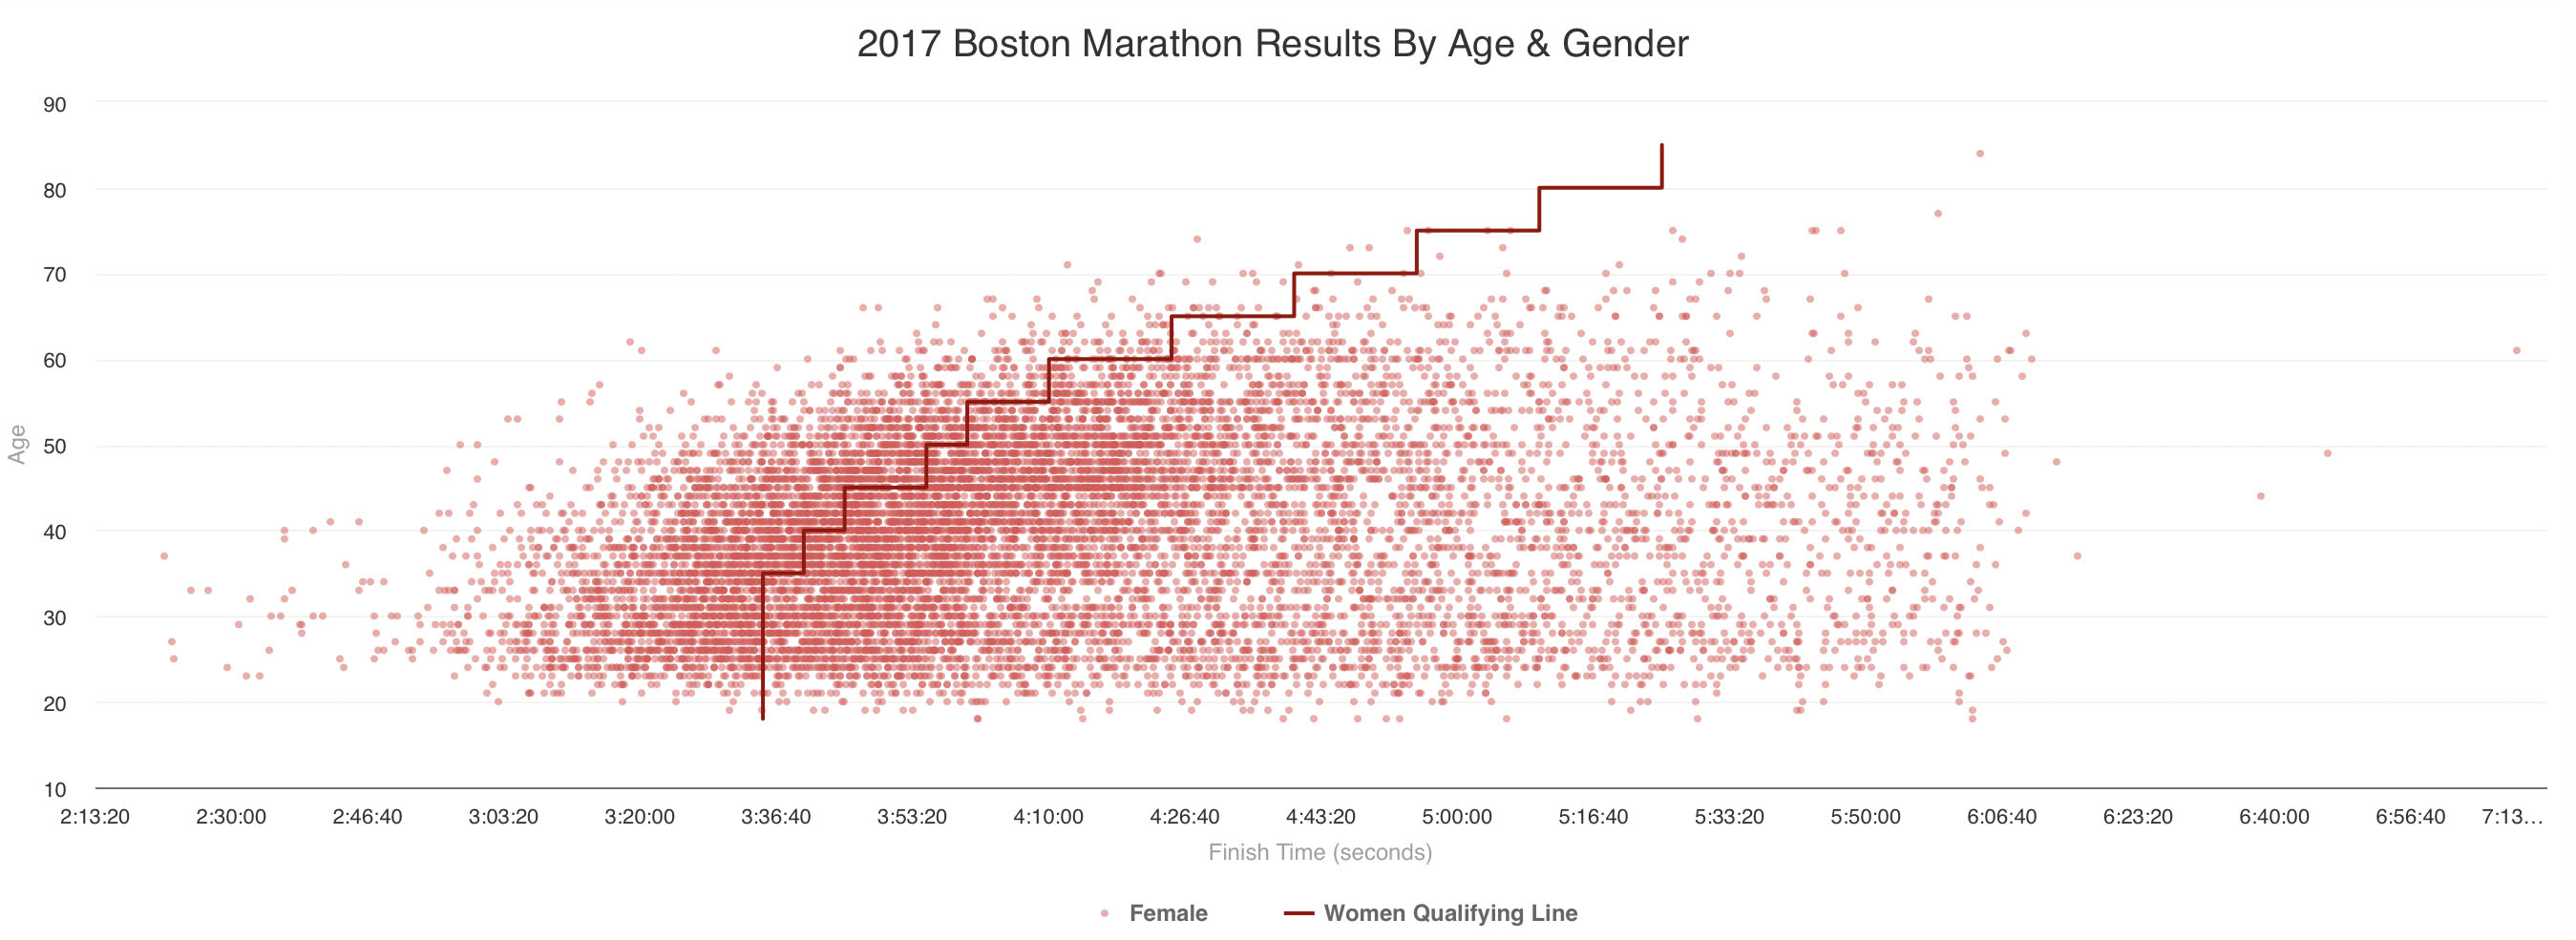
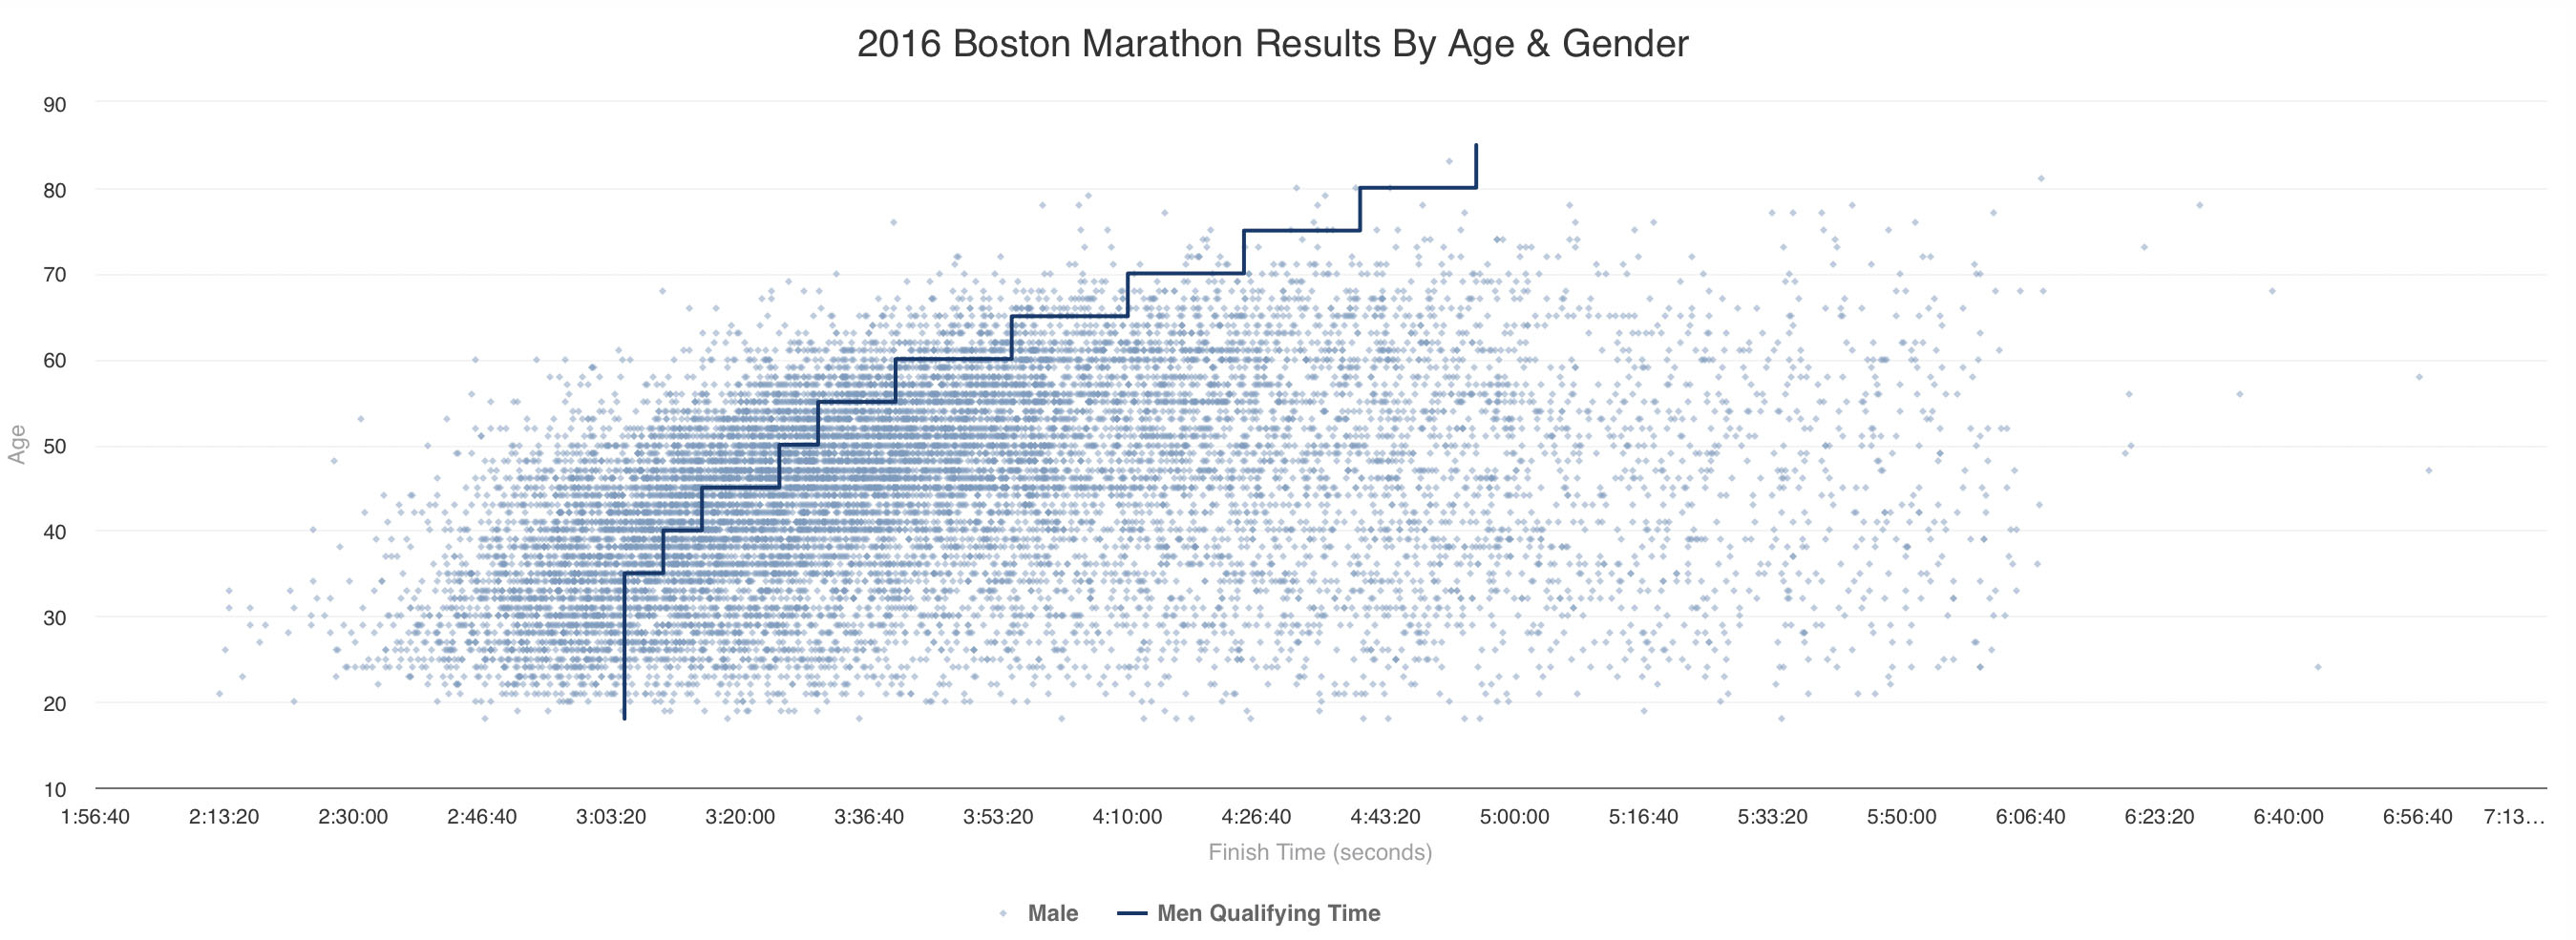
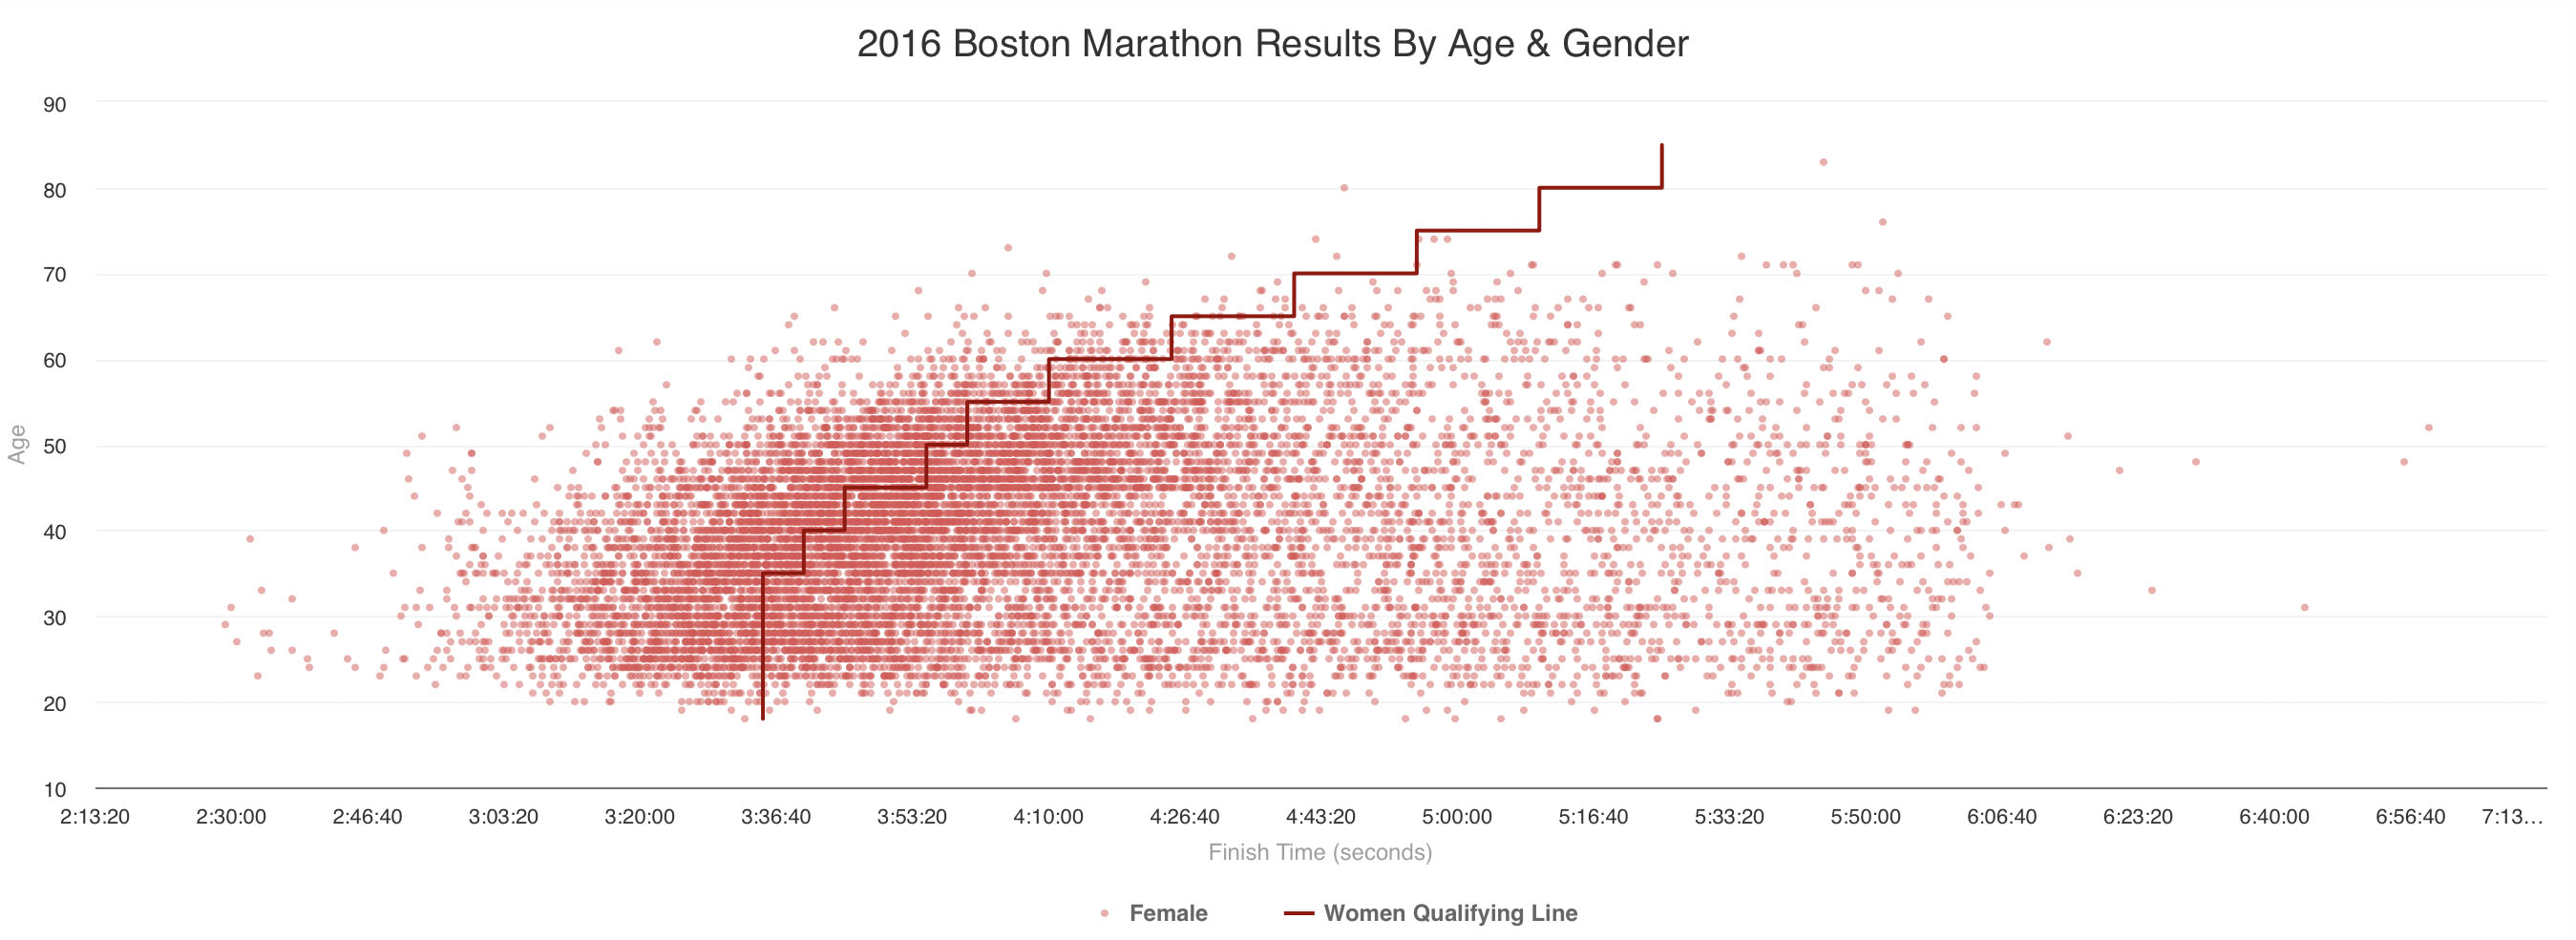
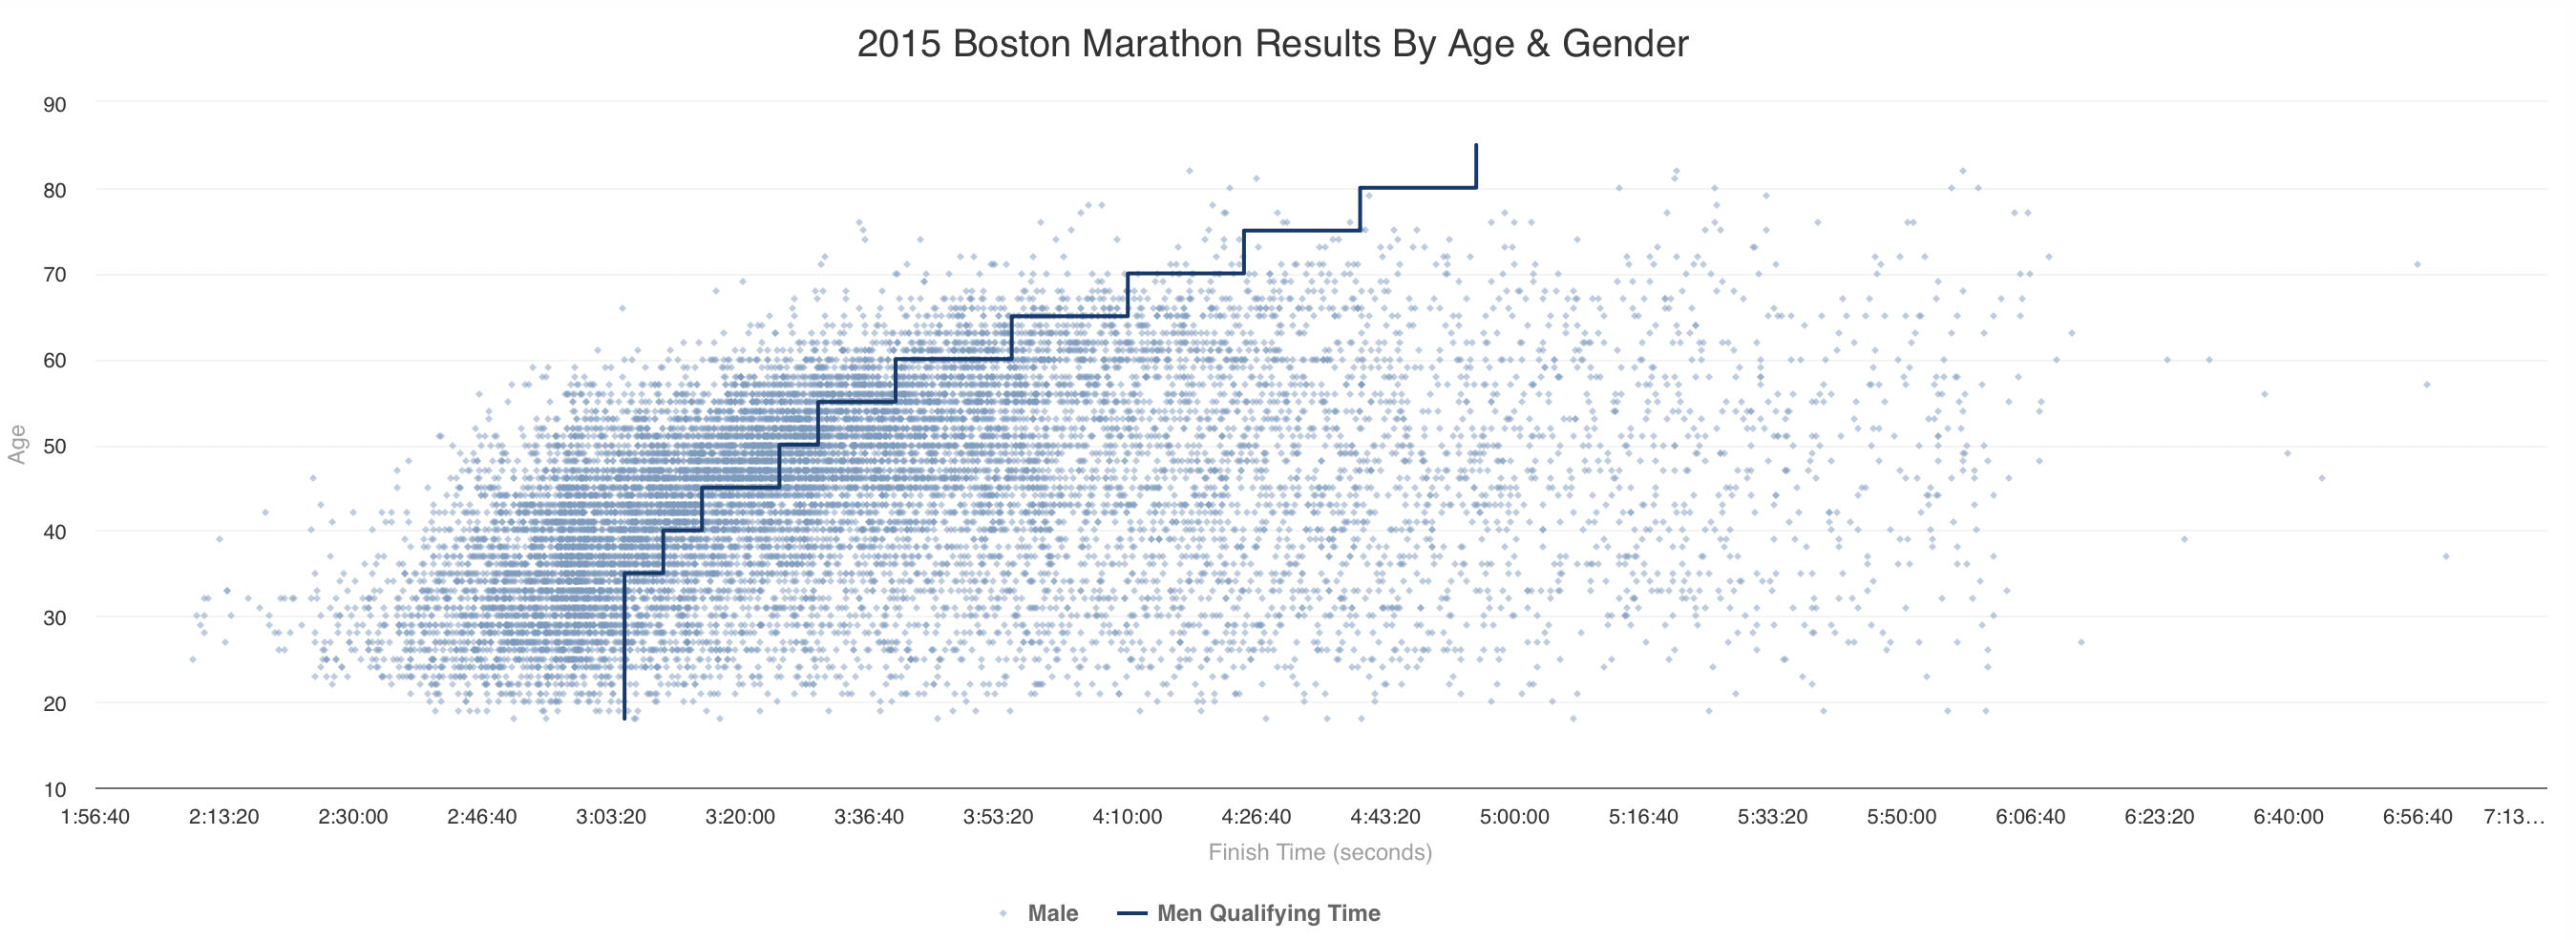
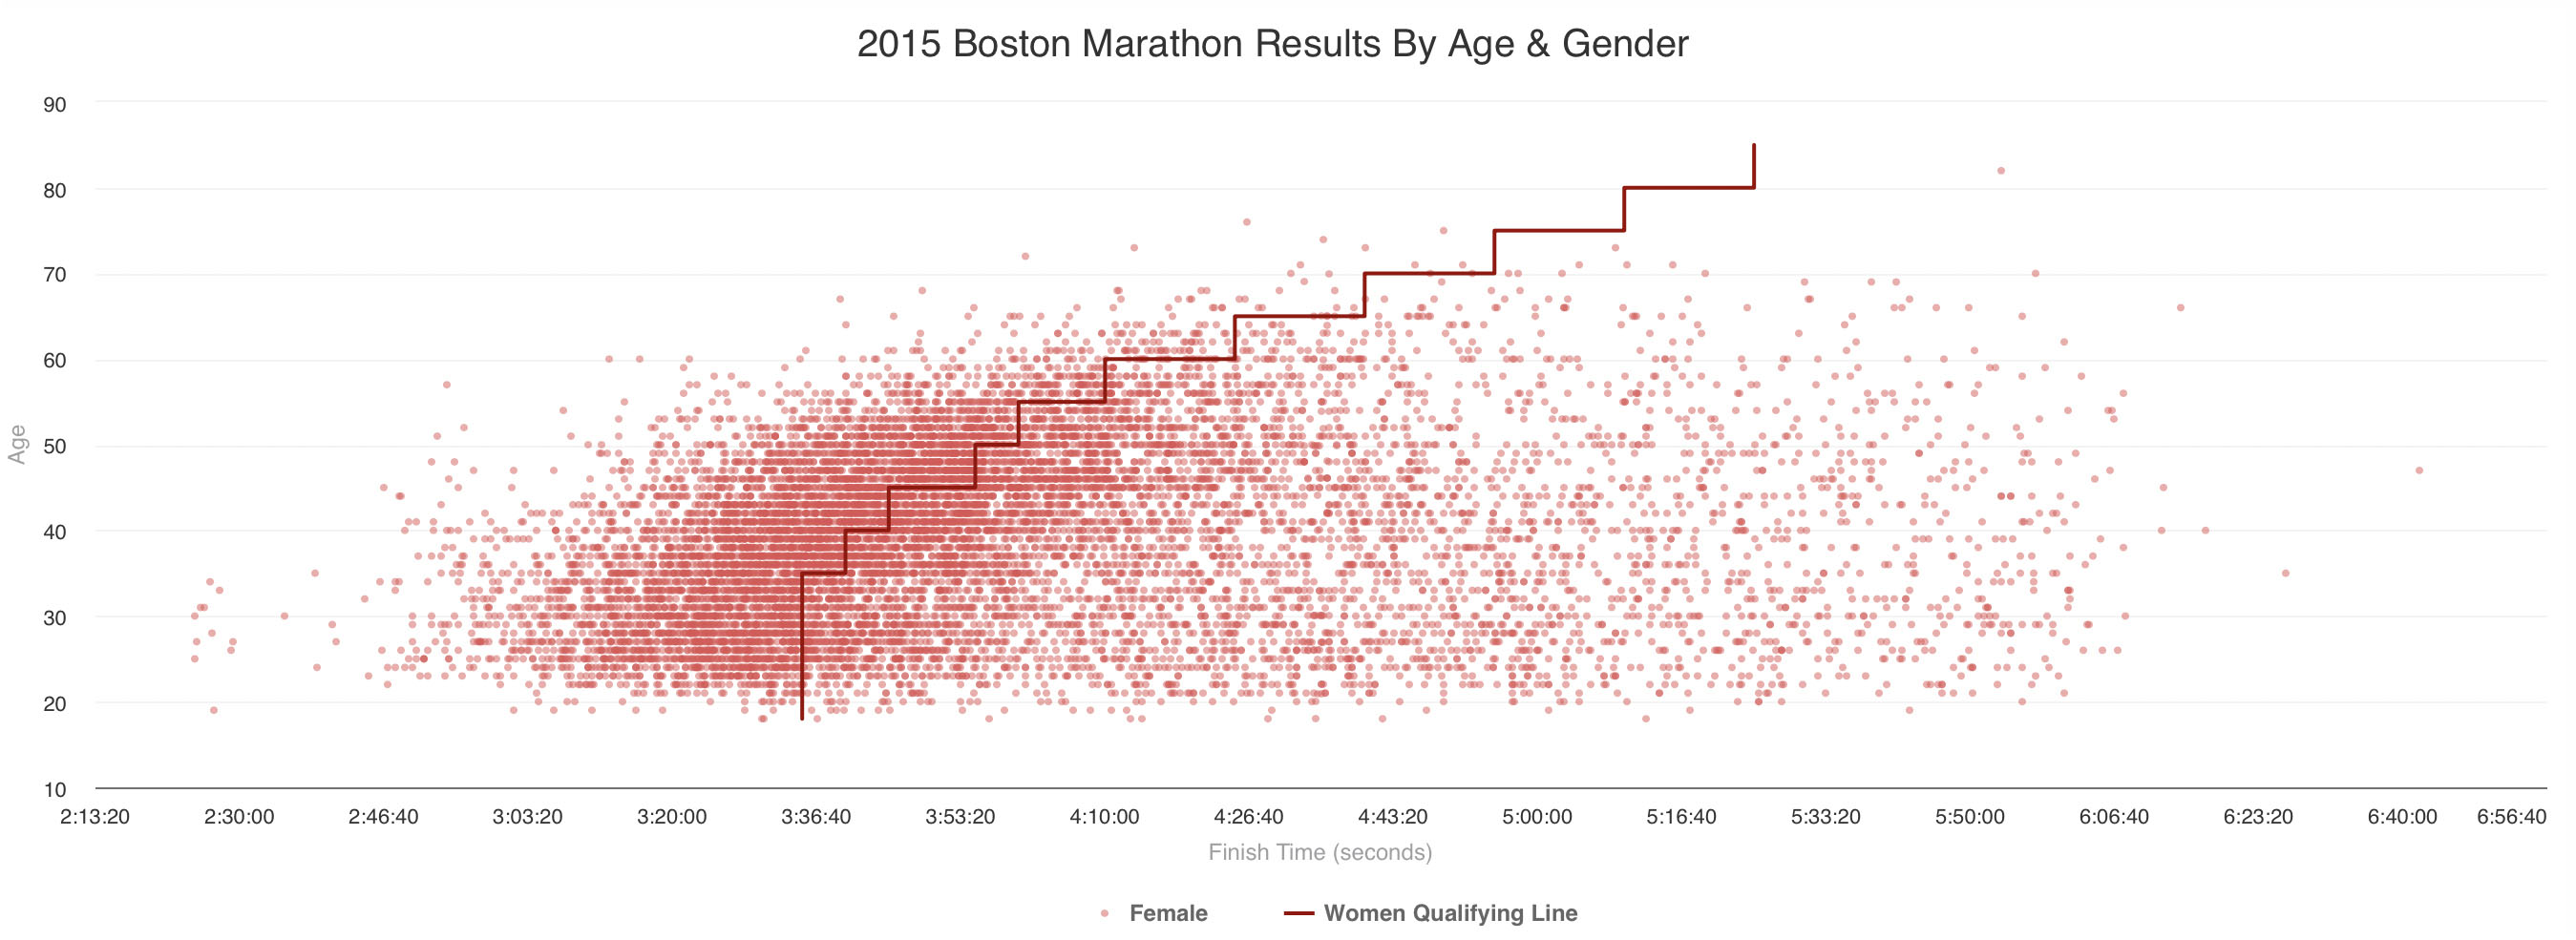
To understand the scatter plot better, I split the results by gender and added lines designating where the BQ times are for the corresponding ages. Note that to get into Boston in 2018, each runner has ran a race more than 3 minutes faster than where the line designates. Every dot on the right side of that line is a runner who failed to have a PR on race day.
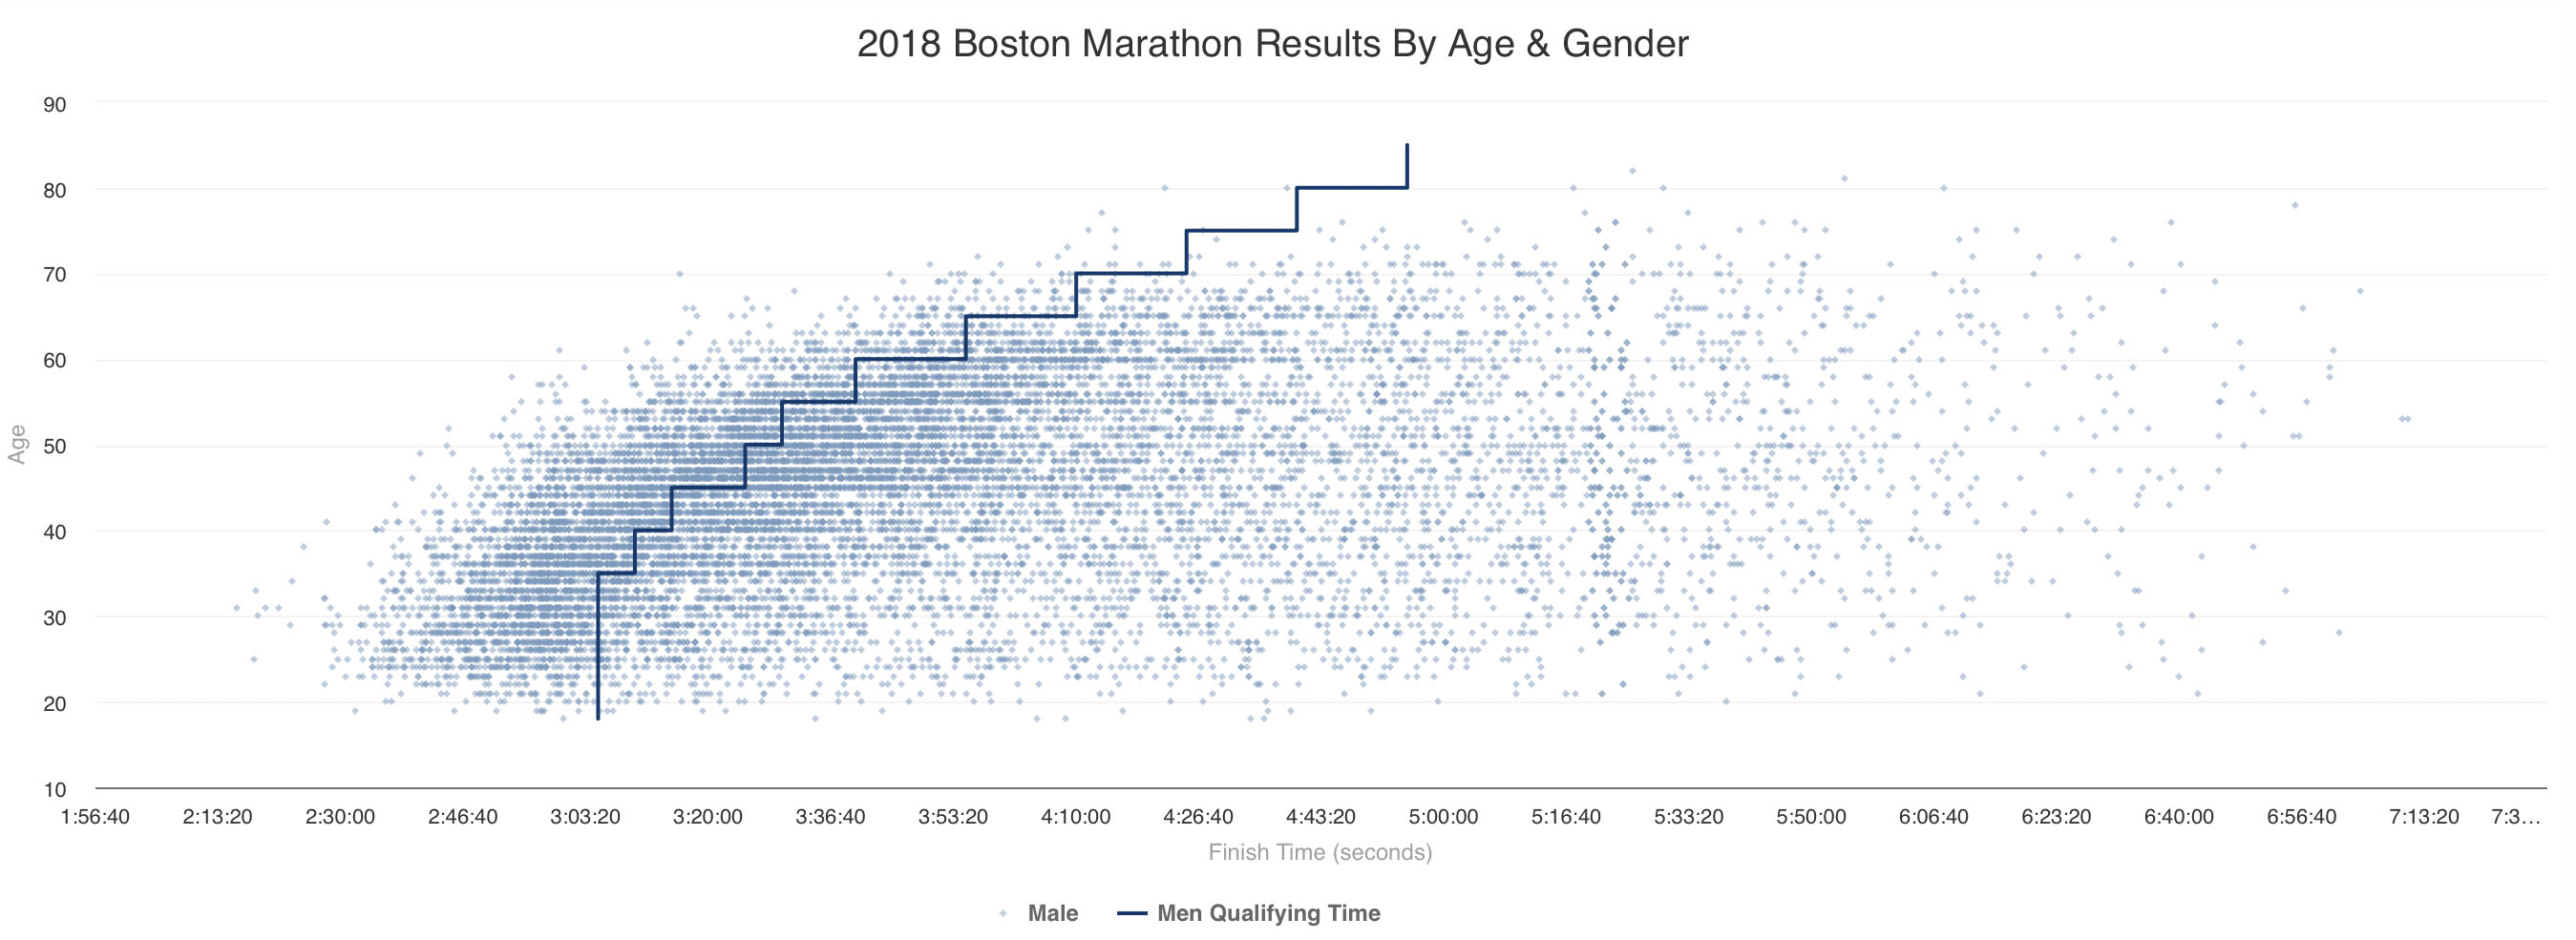
 Every dot on the right side of the line is a runner who failed to match their qualifying time
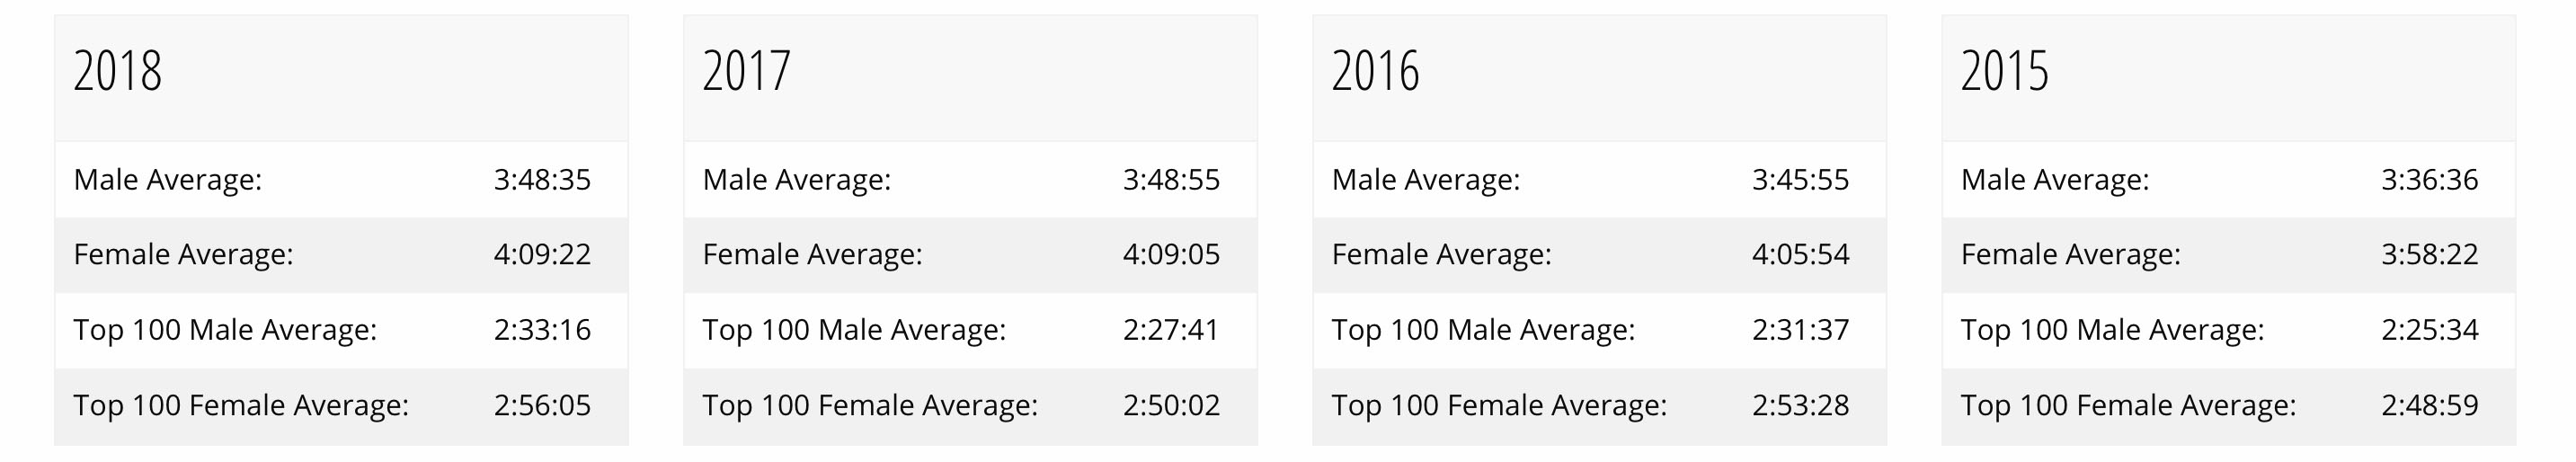
For comparison, here are the same graphs for 2017–2015 for males:
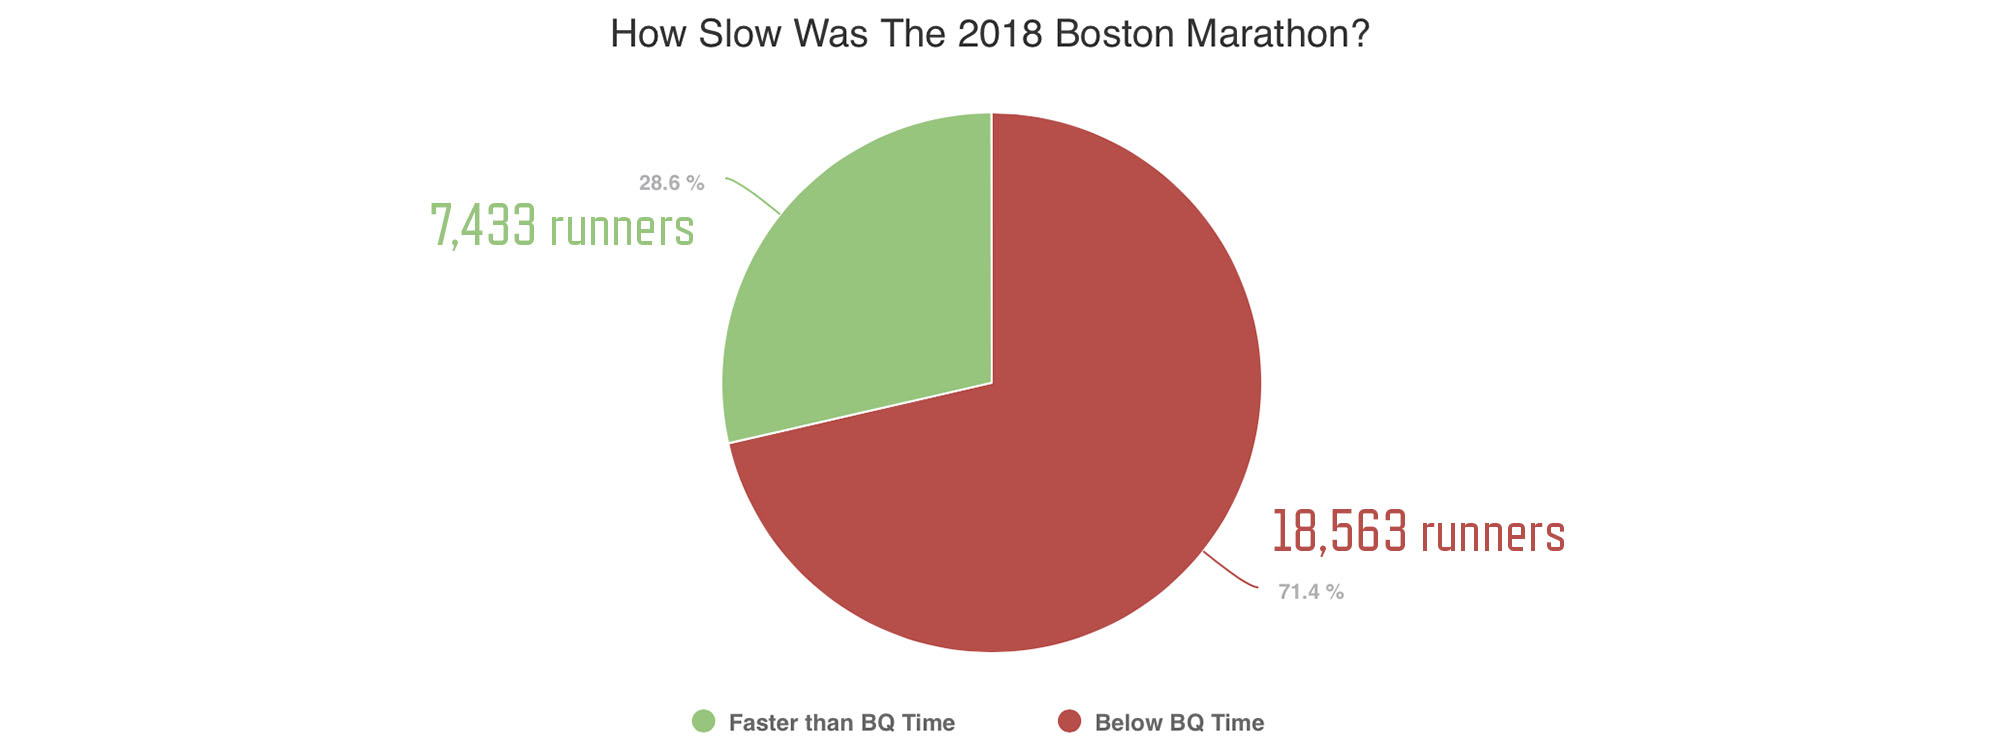
Something doesn’t add up. In order to qualify for Boston 25,996 people were able to beat their qualifying standard by at least 3:23 minutes in 2018. Then on race day 18,563 of these same runners failed to hit the qualifying time? How is it possible that only 29% were able to run a time that they have proven they are capable of?
There could be several reasons why Boston finishing times are so slow. Perhaps the participants are taking in the experience, savoring the moment, and not worrying about running fast. Perhaps just being in the race is enough for most runners and they have nothing else to prove. Perhaps the course is clogged with runners making it hard to pass people. Perhaps the course is more difficult than it would seem. Maybe weather is the determining factor. These are the hypotheses that I am going to attempt to test in this case study. Let’s start with the weather…
Here is what the weather looked like for the last 4 Boston Marathons:
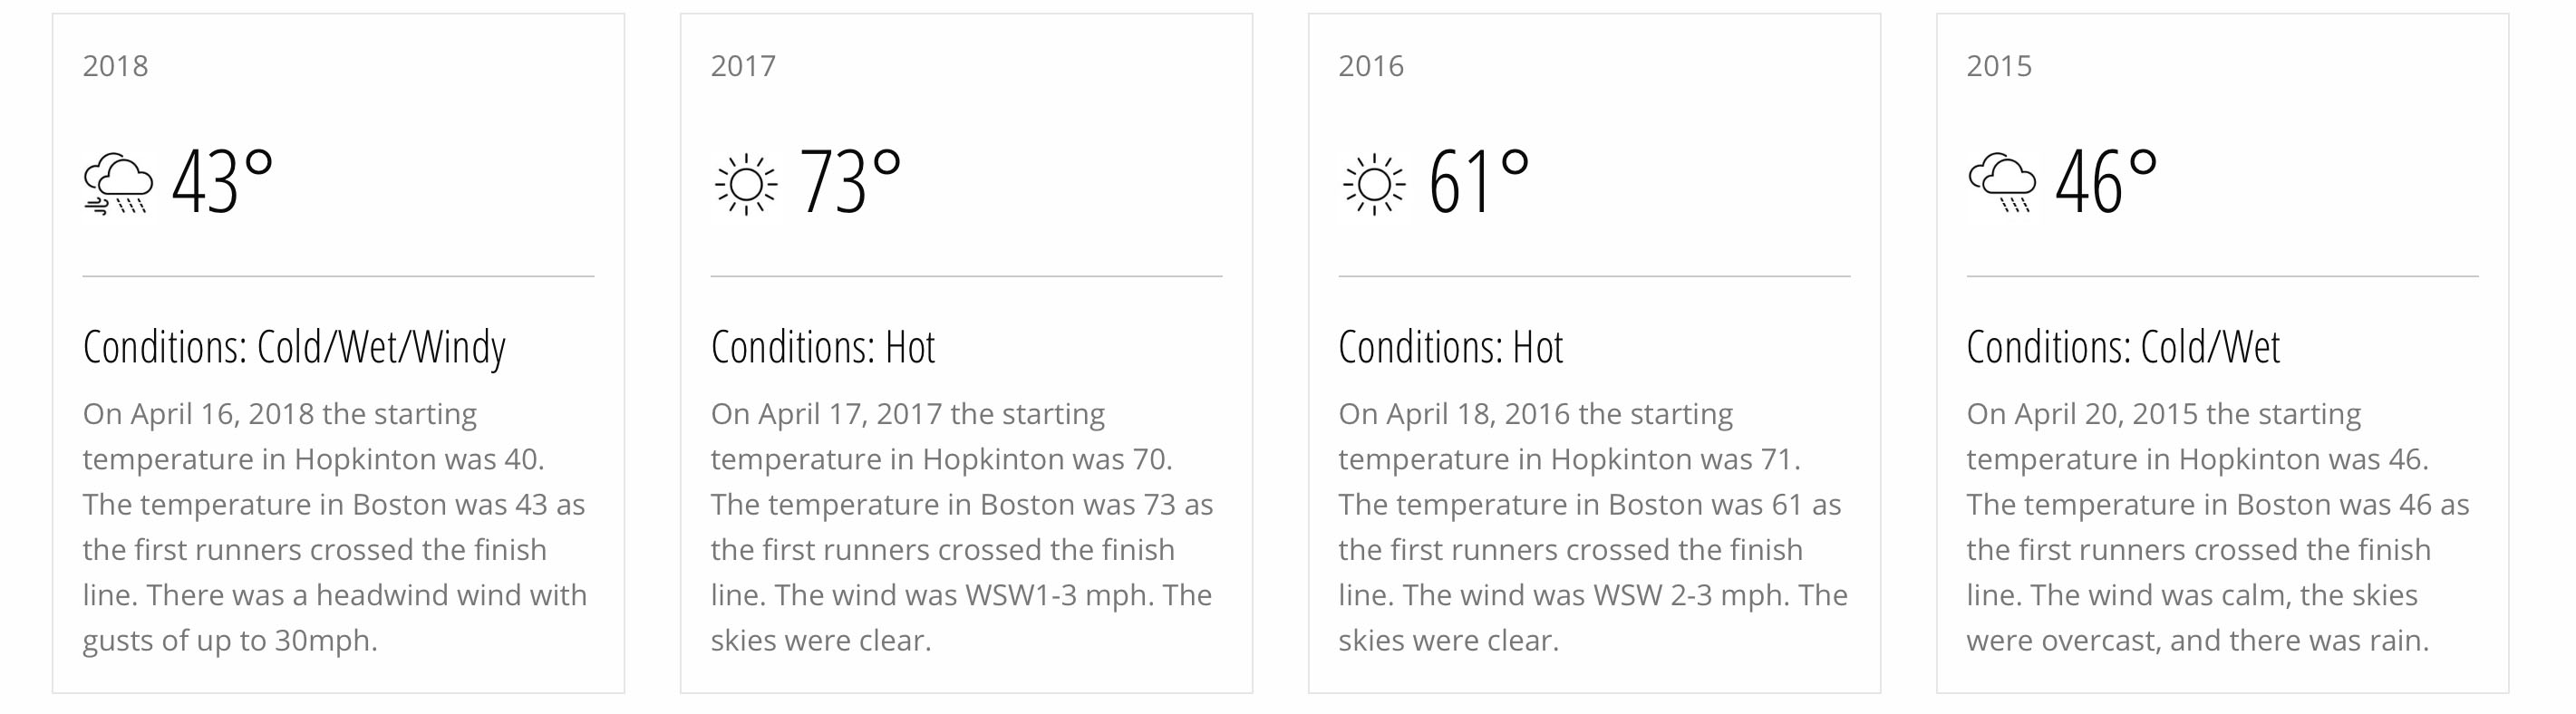
2018: Cold/Wet/Windy 2017: Hot 2016: Less Hot 2015: Cold/Wet
I know what you are thinking. The conditions in 2018 were horrible. Surely this accounts for why only 29% hit their BQ. Surprisingly, not really.
In 2017 the skies were clear and there was very little wind and yet an even smaller percentage of runners matched their qualifying time with 24% qualifying. The percentage of runners who hit their qualifying time in 2016 was 27%. In 2015 (the best weather of the years I have data for) the number of qualifiers hits 39%.
As hard as it is to believe, it appears that if you are trying to hit your BQ, you have a better chance running in cold/wet temperatures (2018, 2015) than when it is 70 degrees and sunny (2017, 2016). Can that be true?
Indulge me with some really broad conclusions here…
In 2018 the weather was horrible but the field was also very strong with qualifiers who beat their qualifying time by 3:23 to get in to the race. Result: 29% got a BQ.
2017 was hot. The field was less strong, beating their qualifying time by 2:09 to get in to the race. Result: 24% got a BQ.
2016 wasn’t as hot as 2017 but the field was a bit stronger, beating their qualifying time by 2:28 to get in to the race. Result: 27% got a BQ.
2015 didn’t have ideal weather, it rained, but the temperature was close to ideal at 46. The field was the weakest of the 4 years, only beating the qualifying time by 1:02 to get into the race. Result: 39% got a BQ. Based on these numbers, the difference between a hot day and a cold day is a swing of 15% (4,000) more people hitting their qualifying time. Add a tailwind to the equation and the results would be even bigger. I would like to analyze data for 2011 when the course record was set and 2012 when the temperature hit 87 degrees.
Does Age and Gender Matter?
One might expect the percentage of runners who hit their BQ on race day to be spread evenly across ages and gender. After all, that’s why the qualifying standards are relaxed as age increases and why there are different standards for men than women. In theory, that should level the field. That’s now what happens, however, as you can see from the charts below.
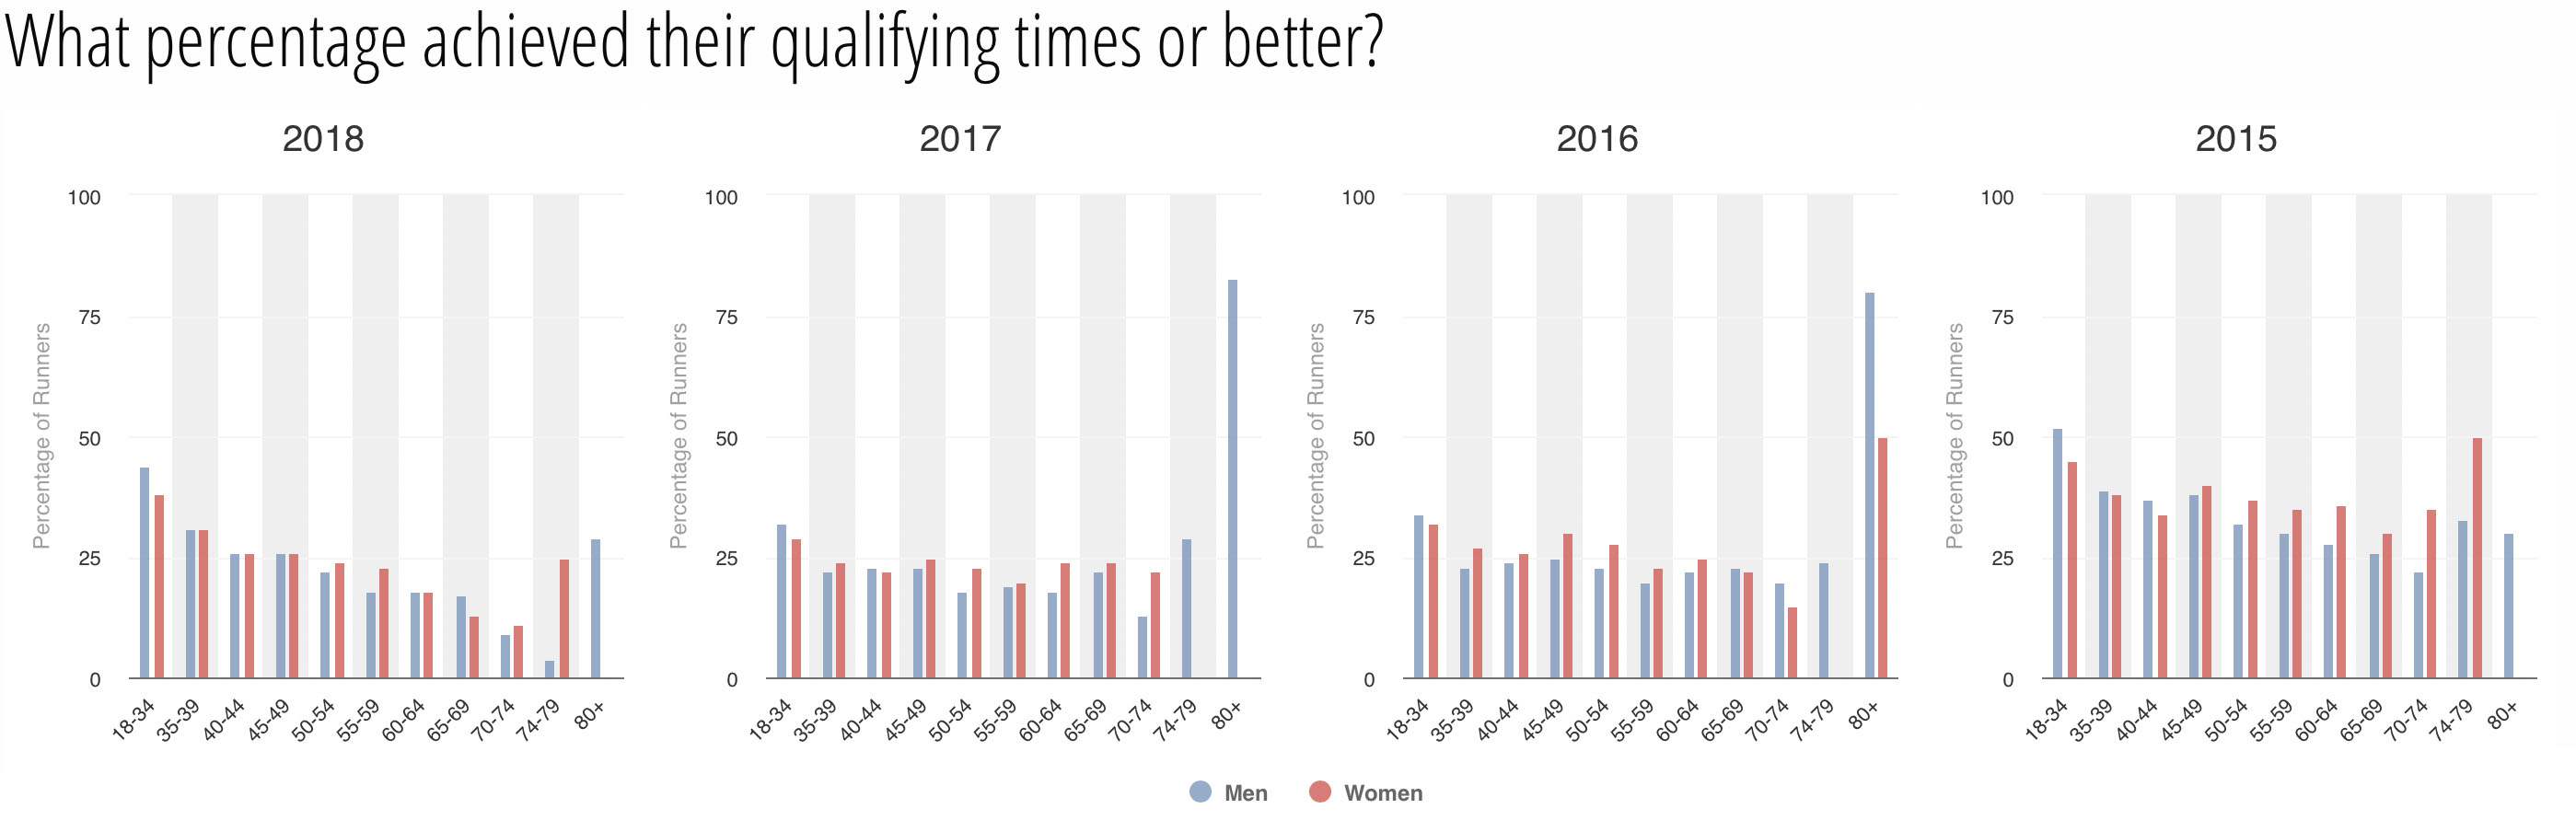
The percentage of runners who hit their qualifying times decreases as age increases. Best case scenario, the young age groups can approach 50% BQs while the middle aged runners are lucky to hit 35%. The 80+ age group has the highest percentages of BQs, but this is also the smallest number of participants with 10 or less runners in any given year.
##How slow are the runners who don’t hit their BQ?
Runners who fail to get a BQ on race day are about 35 minutes slower than their qualifying standard. While this seems outrageous, if you look back at the first scatter charts on this page you can see that this number is going to be skewed considerably by people who are obviously not trying to race. Just look at the amount of dots slower than 5 hours. Regardless, below is a chart showing the average times that runners missed their BQ by.
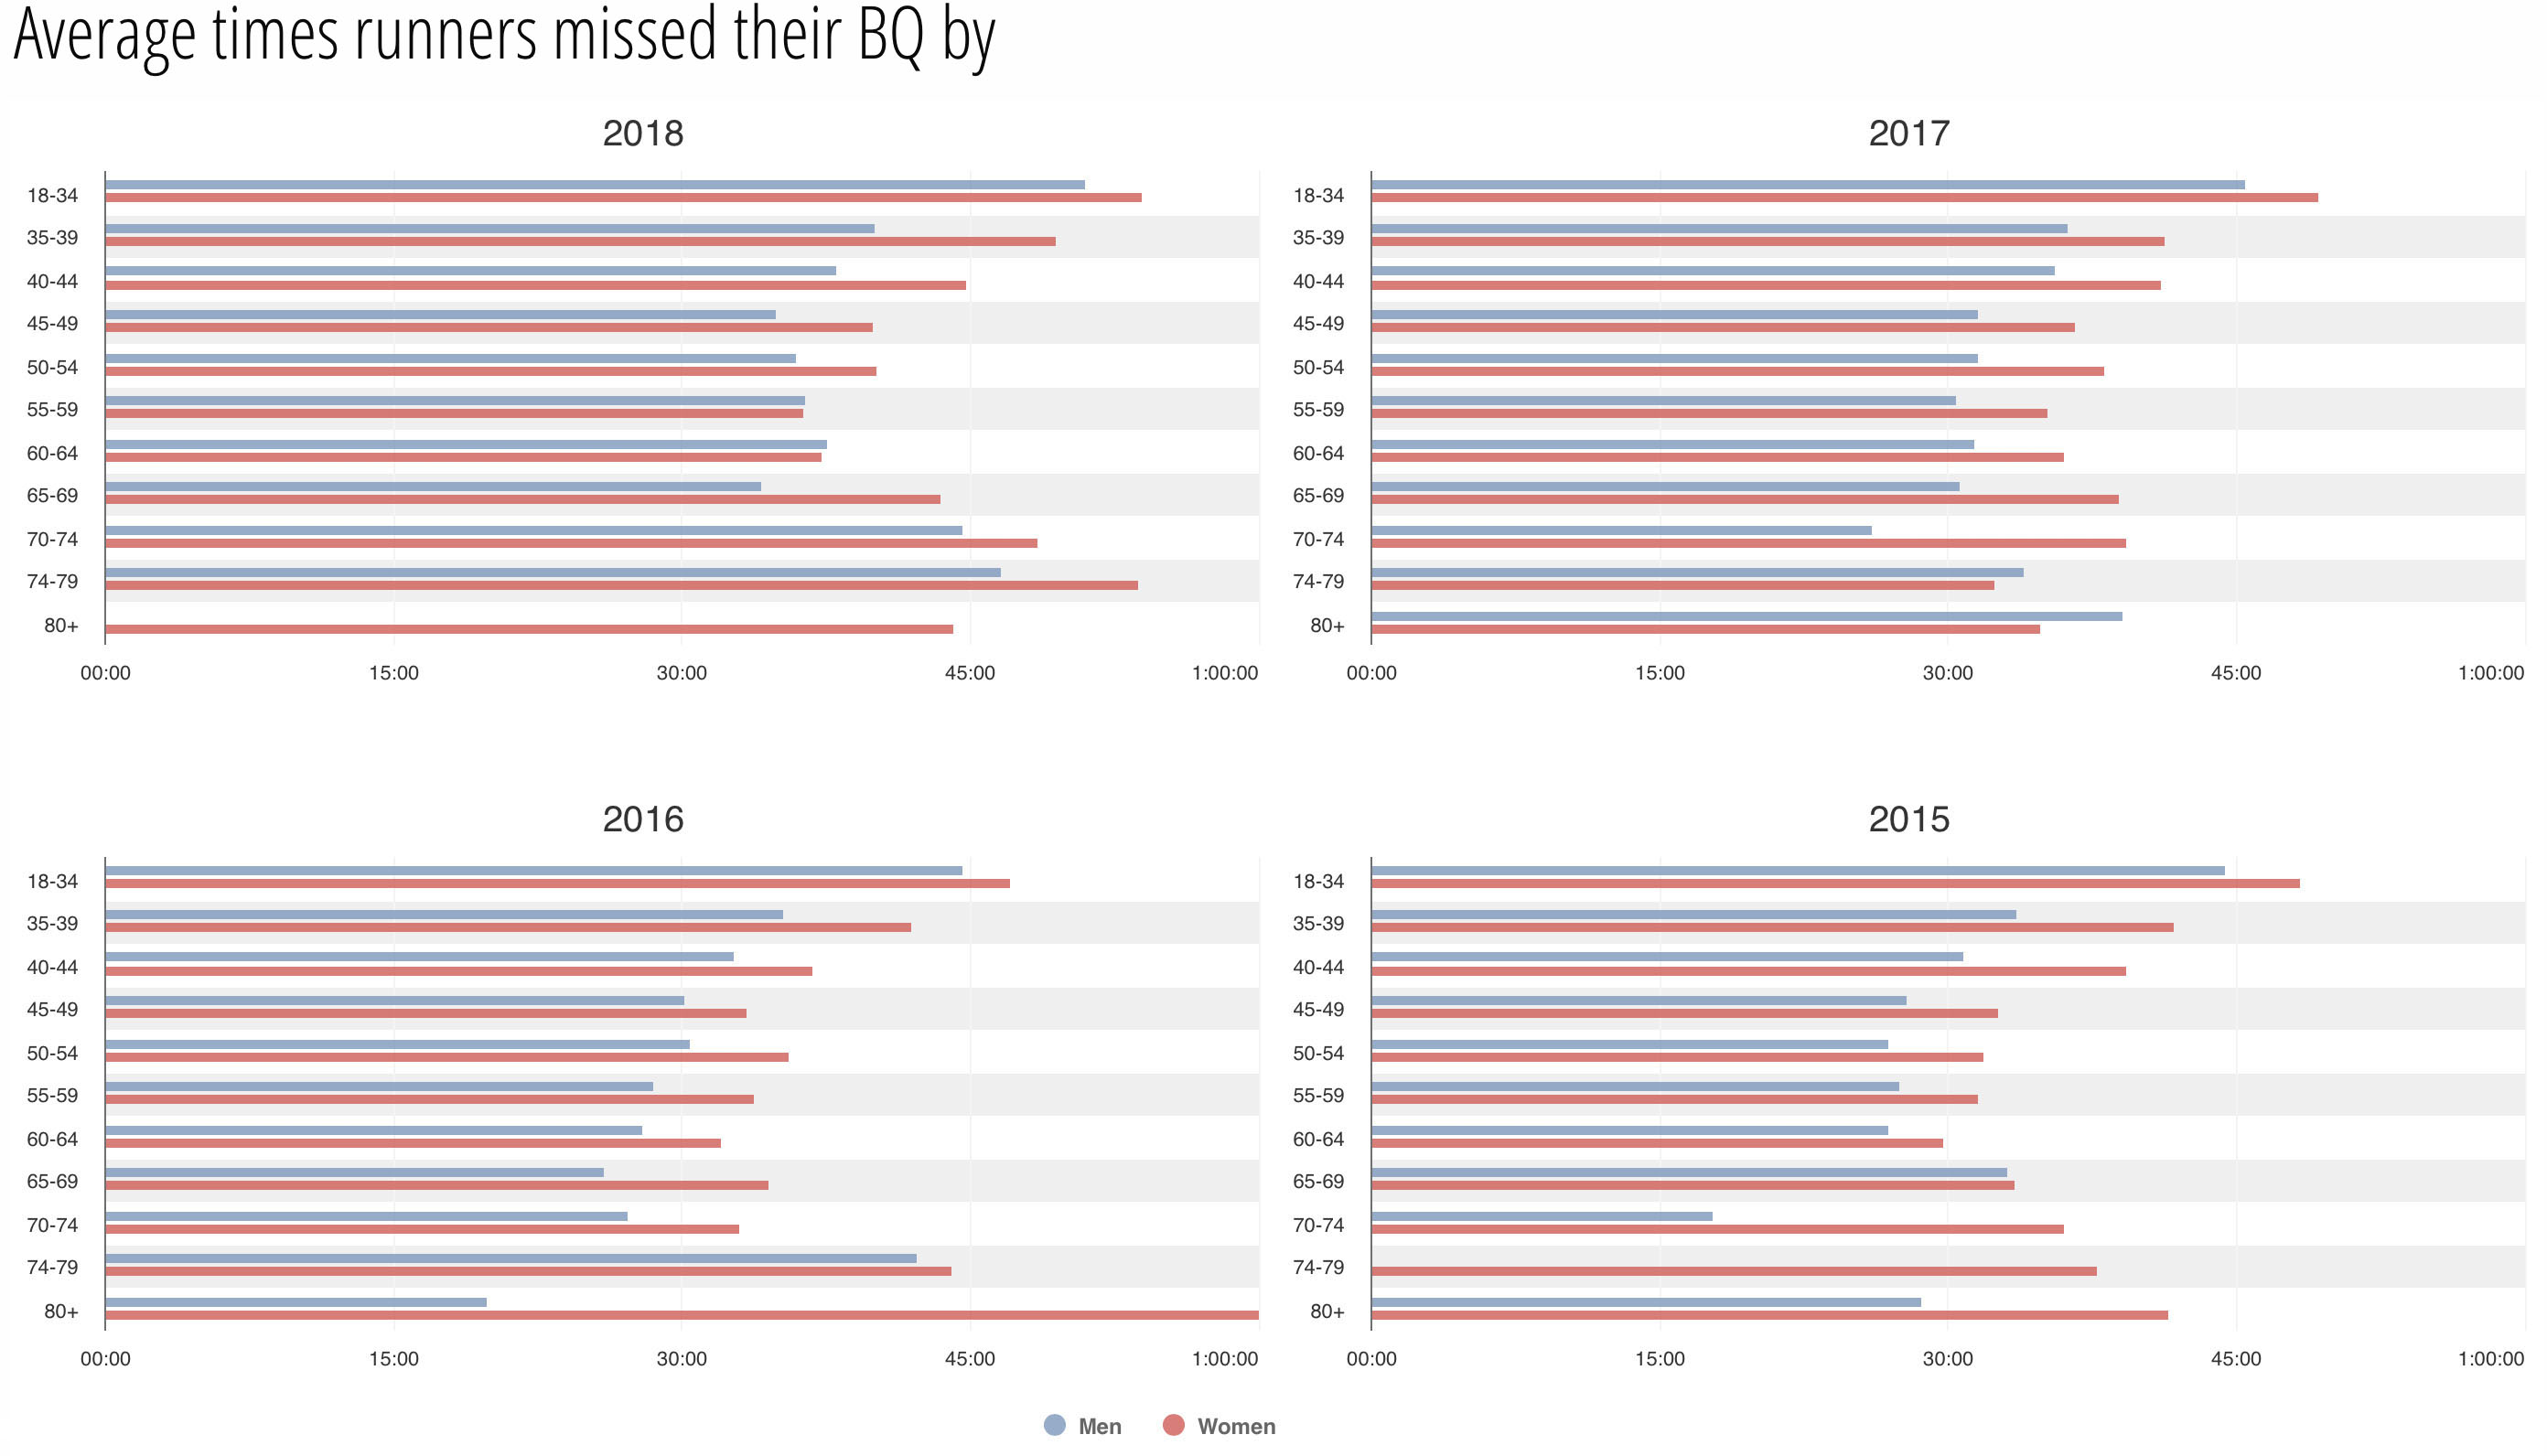 Boston runners who don’t get a BQ on race day miss their qualifying time by about 35 minutes on average.
What about the runners who are Actually trying?
If we concede that the averages are skewed by people who aren’t even trying, let’s see what happens if we limit the data to athletes who are within 30, 15, 5, and 1 minutes of their qualifying times. And for fun, let’s count the unfortunate souls who have to live with the fact that they were within 10 seconds of a BQ.
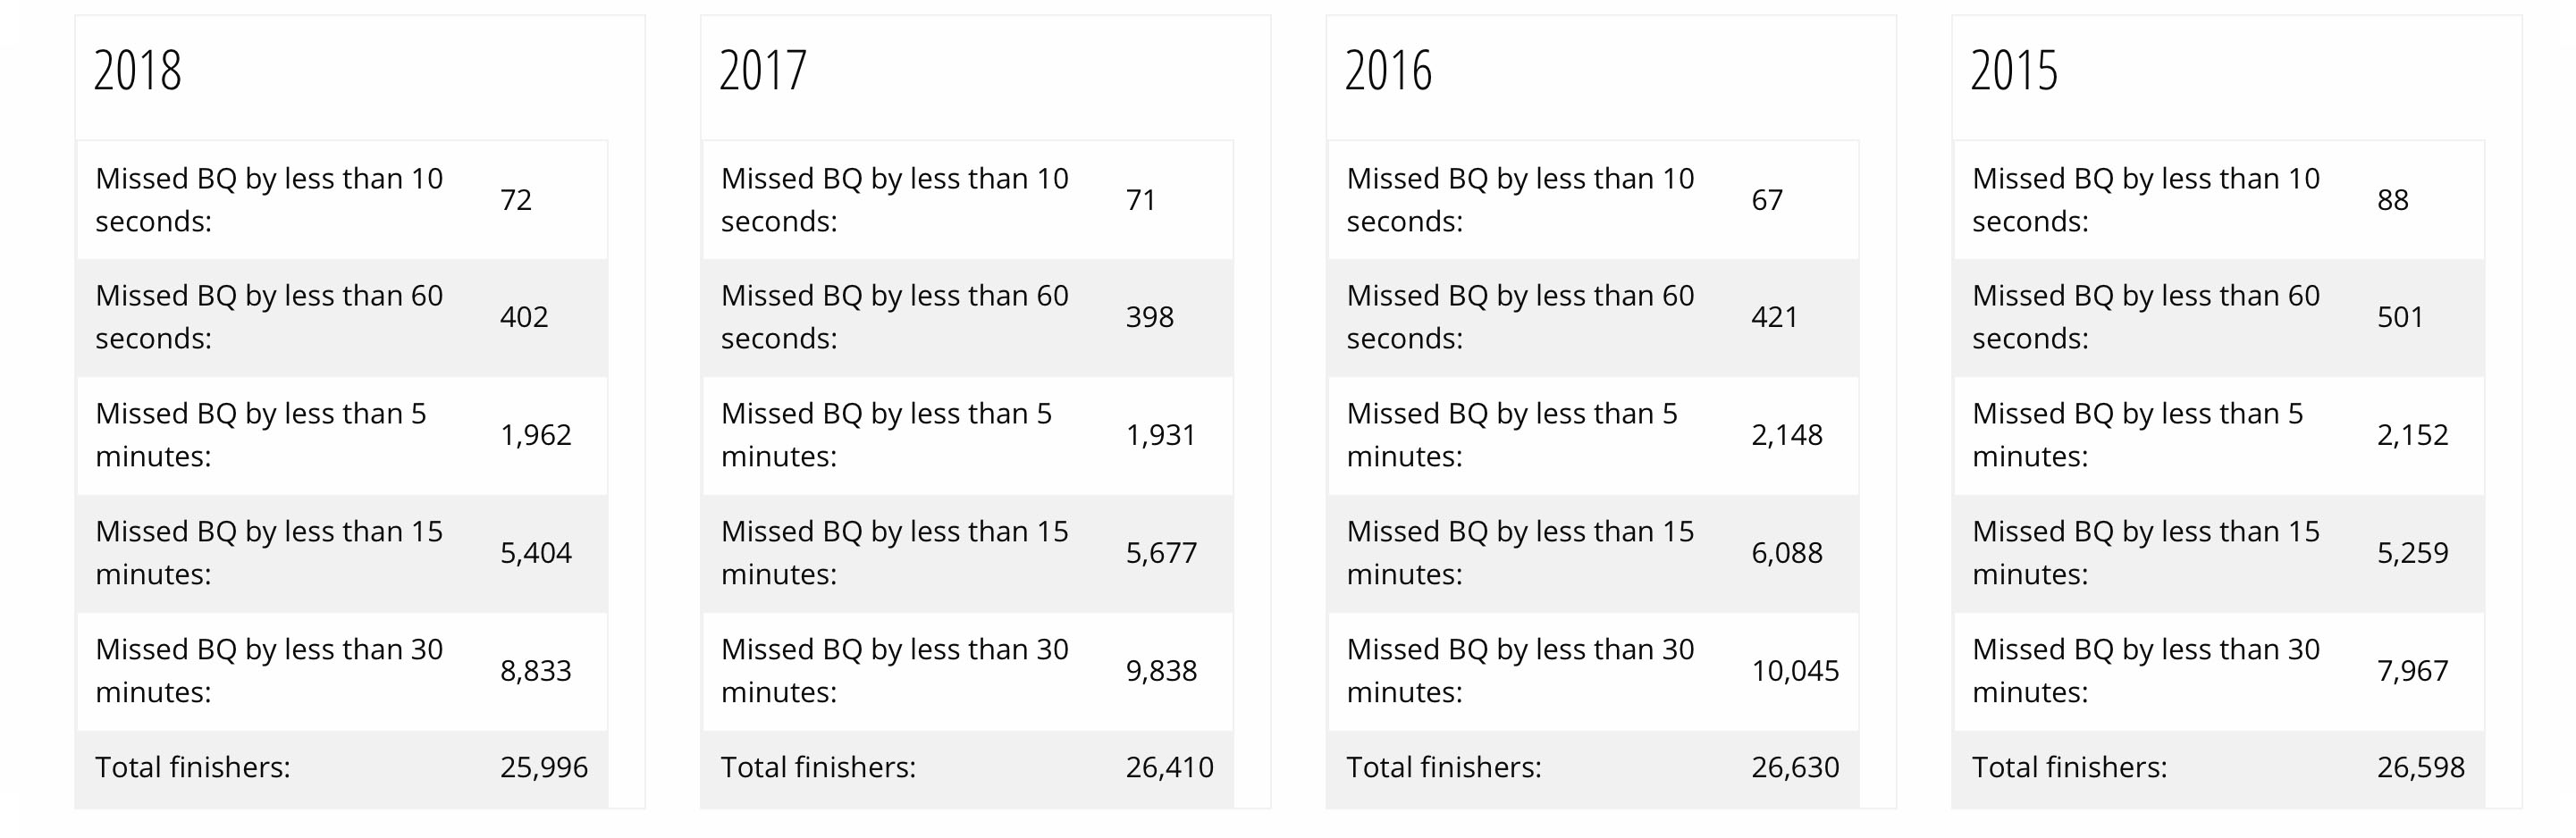 Each year there are about 75 runners who miss a BQ by less than 10 seconds.
To sum this up in round numbers, about 1/3 of the entire field usually finish 30 minutes short of achieving a BQ on race day. About 21% are within 15 minutes. About 8% are within 5 minutes. And finally a little more than 1% are within 1 minute of a BQ.
2019 Prediction
In 2019, if the weather is cool, I predict that only 35–40% of the runners will hit their 2020 qualifying times. If there is a tailwind they might be able to hit 45%, but that is pushing it. Although the 2019 field is the strongest ever (remember they had to beat their BQ by 4:52 just to get into the race) the qualifying standards increased for 2020 by 5 minutes . If the data holds, you can expect more than 60% of the runners to underperform in 2019.
Thanks for reading and be sure to read part 1 if you missed it. I am already digging through more Boston Marathon data for part 3, so stay tuned for more. If you enjoyed this analysis, please share it with friends.
About Me
My name is Adrian Hanft. I am a runner from Colorado with a passion for data, design, and storytelling. You can follow my runs on Strava and my writing here or on Medium. Stay creative.