October 22, 2019
Qualifying for Boston in 2021 Will Be Harder than Ever
Boston Marathon Data Analysis, Part 3
Registration for the 2020 Boston Marathon has closed and there is a brand new set of data ready for analysis. If you are one of the runners who was accepted, congratulations! Qualifying for Boston is not easy, and as we will see shortly, it shows no signs of getting easier.
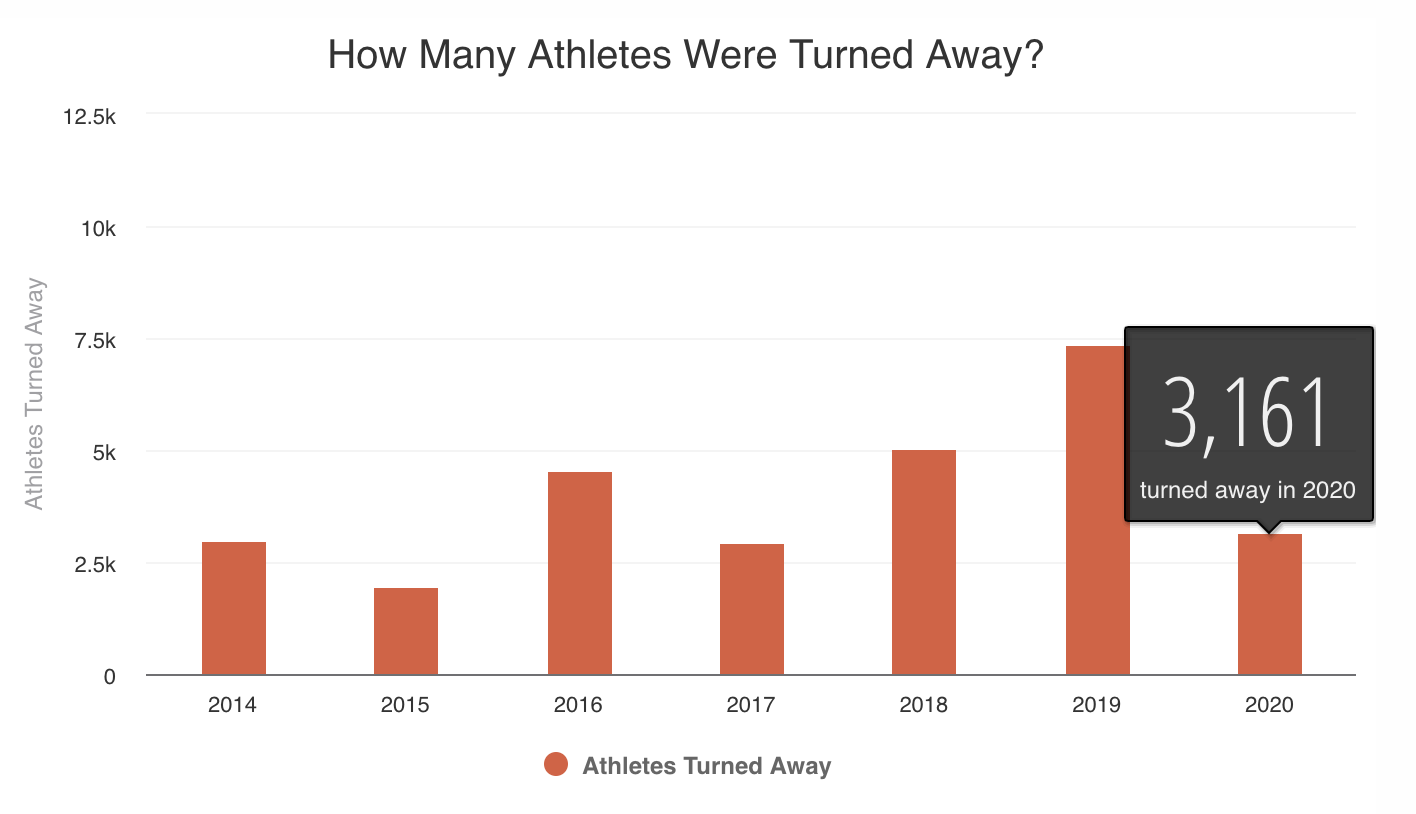
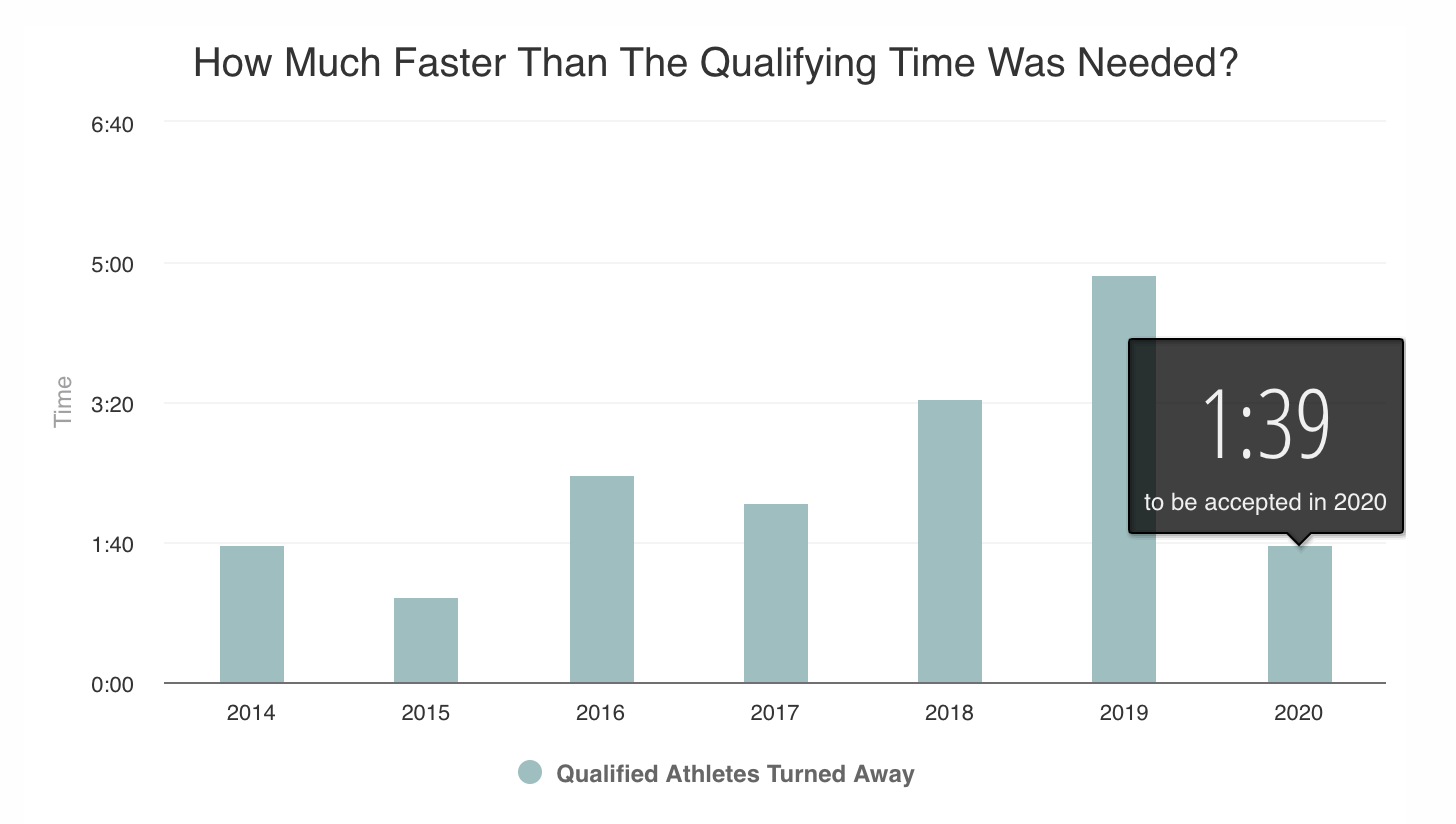
As you might remember from my first analysis, the qualifying standards needed to be adjusted in 2020 because so many people were being turned away. In fact, nearly 1 in 4 runners who applied in 2019 were rejected despite having ran fast enough to qualify. Although the 5 minute adjustment helped, another 3,161 people were turned away this year. This year you needed to beat your qualifying time by 1:39 to be accepted.
Cutoff Times:
2014: You needed to beat your qualifying time by 1 minute, 38 seconds
2,976 people turned away
2015: You needed to beat your qualifying time by1 minute, 2 seconds
1,947 people turned away
2016: You needed to beat your qualifying time by 2 minutes, 28 seconds
4,562 people turned away
2017: You needed to beat your qualifying time by 2 minutes, 9 seconds
2,957 people turned away
2018: You needed to beat your qualifying time by 3 minutes, 23 seconds
5,062 people turned away
2019: You needed to beat your qualifying time by 4 minutes, 52 seconds
7,248 people turned away
2020: After adjusting the qualifying standard by 5:00 you still needed to beat your qualifying time by 1 minute, 39 seconds
3,161 people turned away
2020: More Participants, but a Smaller Percentage of Qualifiers
Surprisingly, the total number of runners in 2020 will increase from 30,000 to 31,500 runners. Before you get your hopes up, those slots will be reserved for special invitation for charity participants. While the Boston Marathon website still advertises that 80% of the runners actually qualify for the race, the additional 1,500 charity runners decreases the percentage to 77.3% for qualifying athletes by my math.
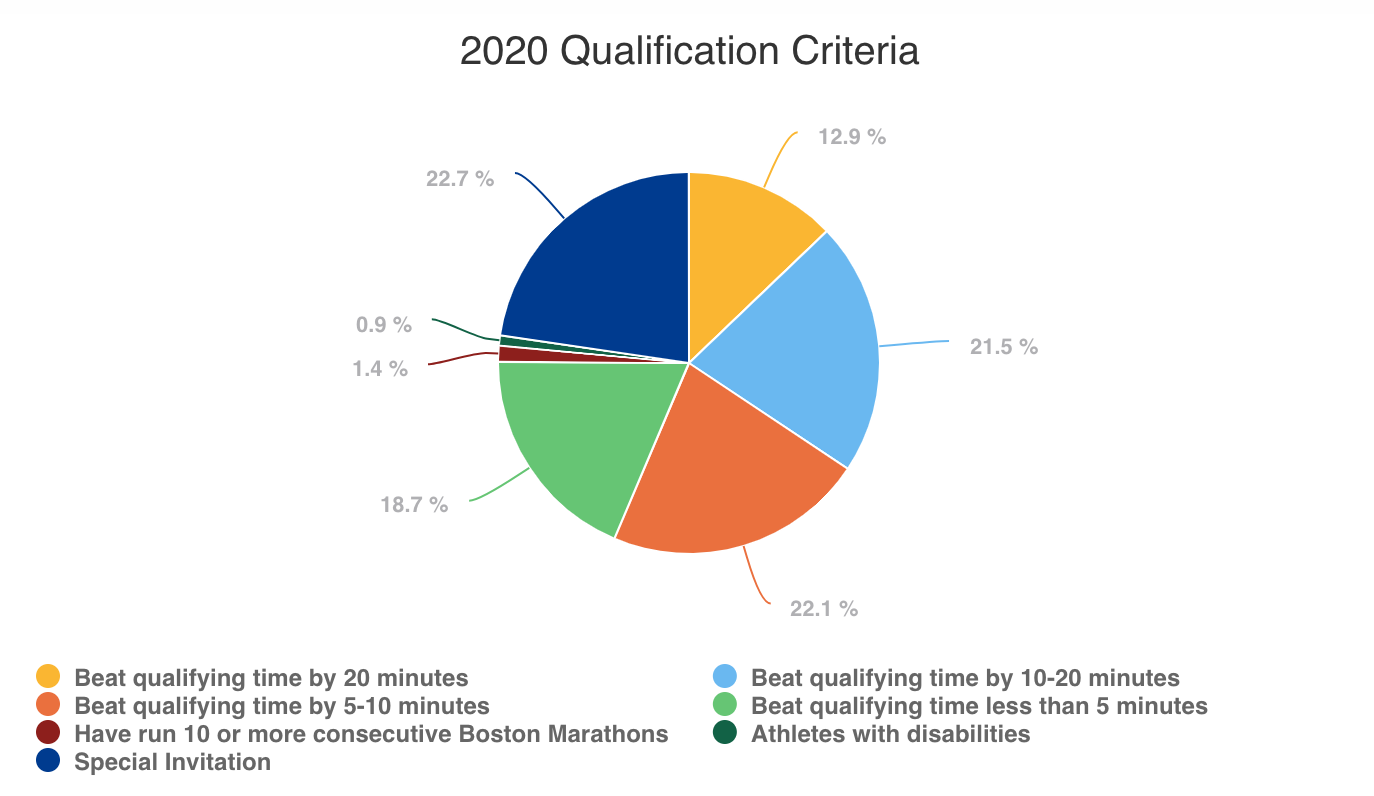
The number of runners on the bubble, beating their time by less than 5 minutes shows just how competitive the slow side of the race is. In the last 3:21 on the edge of a rejection letter sit 5,885 runners or 18.7% of the field.
What Finishing Time Should You Aim for in 2021?
The qualifying times for 2021 haven’t been announced yet, but I don’t expect them to make another adjustment. If standards remain the same, I would recommend aiming to beat your qualifying time by 3 minutes, preferably 4. Even that is cutting it really close.
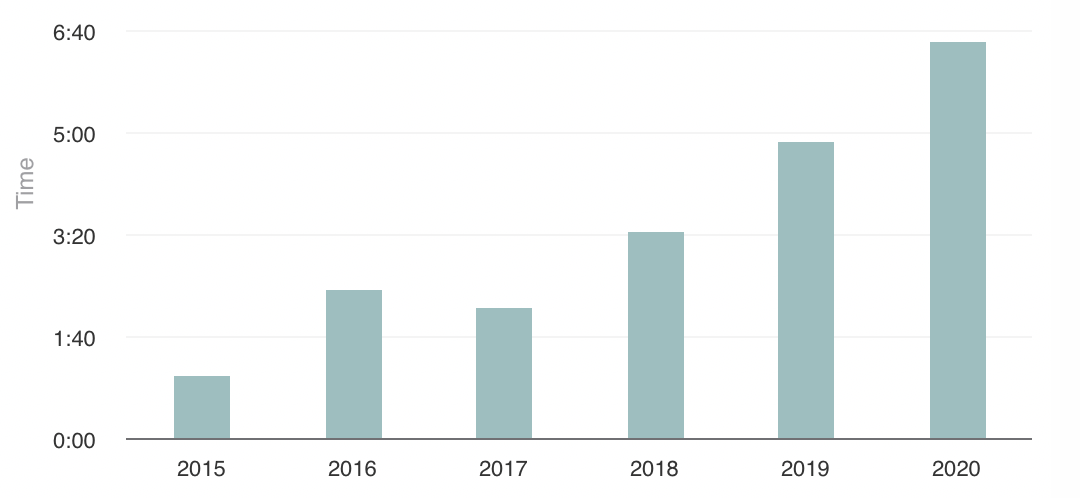
Over the last 6 years, the accepted times have decreased about 1:30 per year. Last year (taking into account the 5 minute overall adjustment) the overall decrease was 1:48 faster. The graph below shows the steady increase of the minimum qualifying times.
Are Humans Getting Faster?
It is tempting to think that the ever-increasing difficulty in getting accepted to Boston is a sign that average runners are getting faster. With Eliud Kipchoge running the first sub-two hour marathon this month shortly followed by Brigid Kosgei setting the female marathon record, nobody would blame you for thinking humans are improving. Unfortunately, I that doesn’t seem to be the case. Here’s what the data shows…
After crunching the numbers on the 2019 Boston Marathon, I can confirm that my second post in this series “Why is the Boston Marathon So Slow?” still holds up.
Despite better than expected weather, including a 13mph tail wind, average finish times in 2019 were only 5:34 faster for men and 4:04 faster for women. Granted, that is nothing to sneeze at, but let’s not forget how bad the weather in 2018 was. And if you look at the average times historically, the best argument you could make is that average speeds are leveling out. Here is the entire history of Boston’s average times:
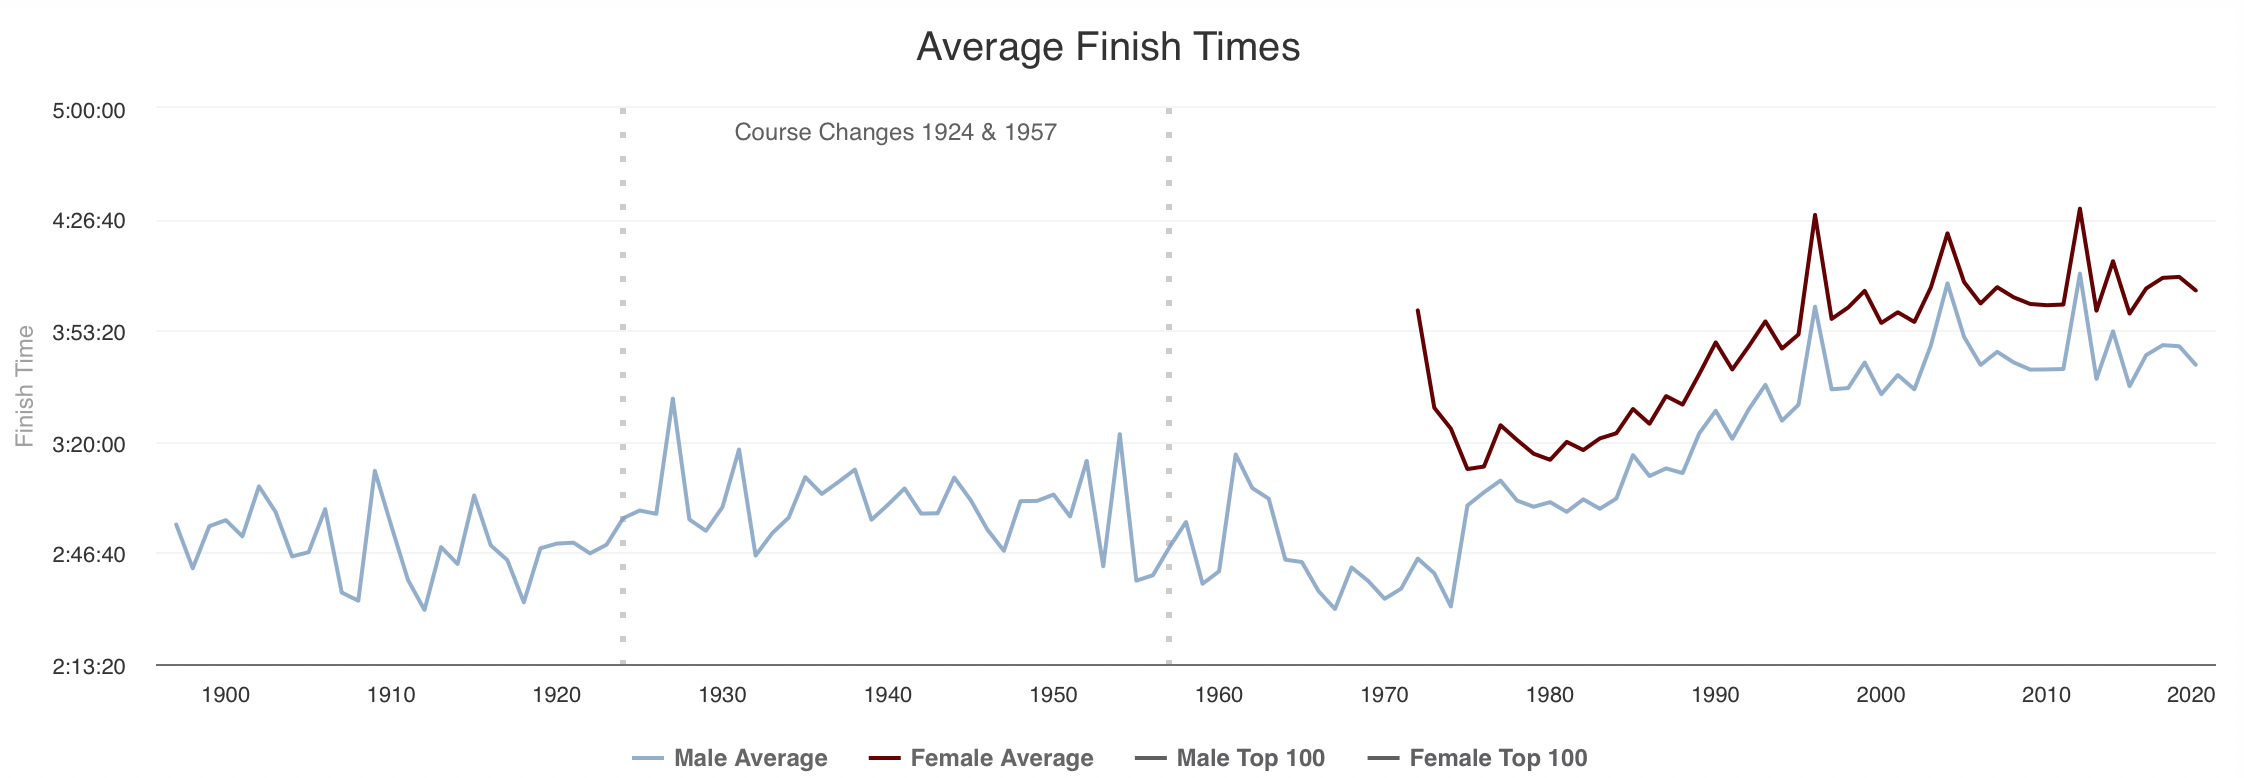
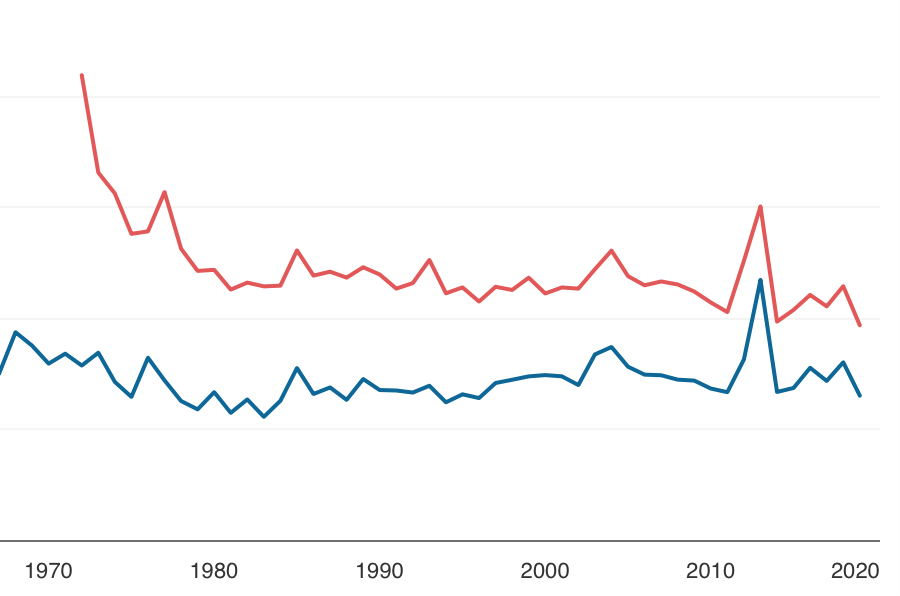
But what about the elites, you are wondering? Well, if you take the averages of only the top 100 finishers, the picture is slightly better. Still, you have to squint at the graph to see the gains.
No, rather than an evolution of our species, a better explanation for the difficulty in reserving a spot at the starting line for Boston is most easily explained by the increasing popularity of the race. That’s not a bad thing, it makes the achievement all the more meaningful to those of us who get accepted.
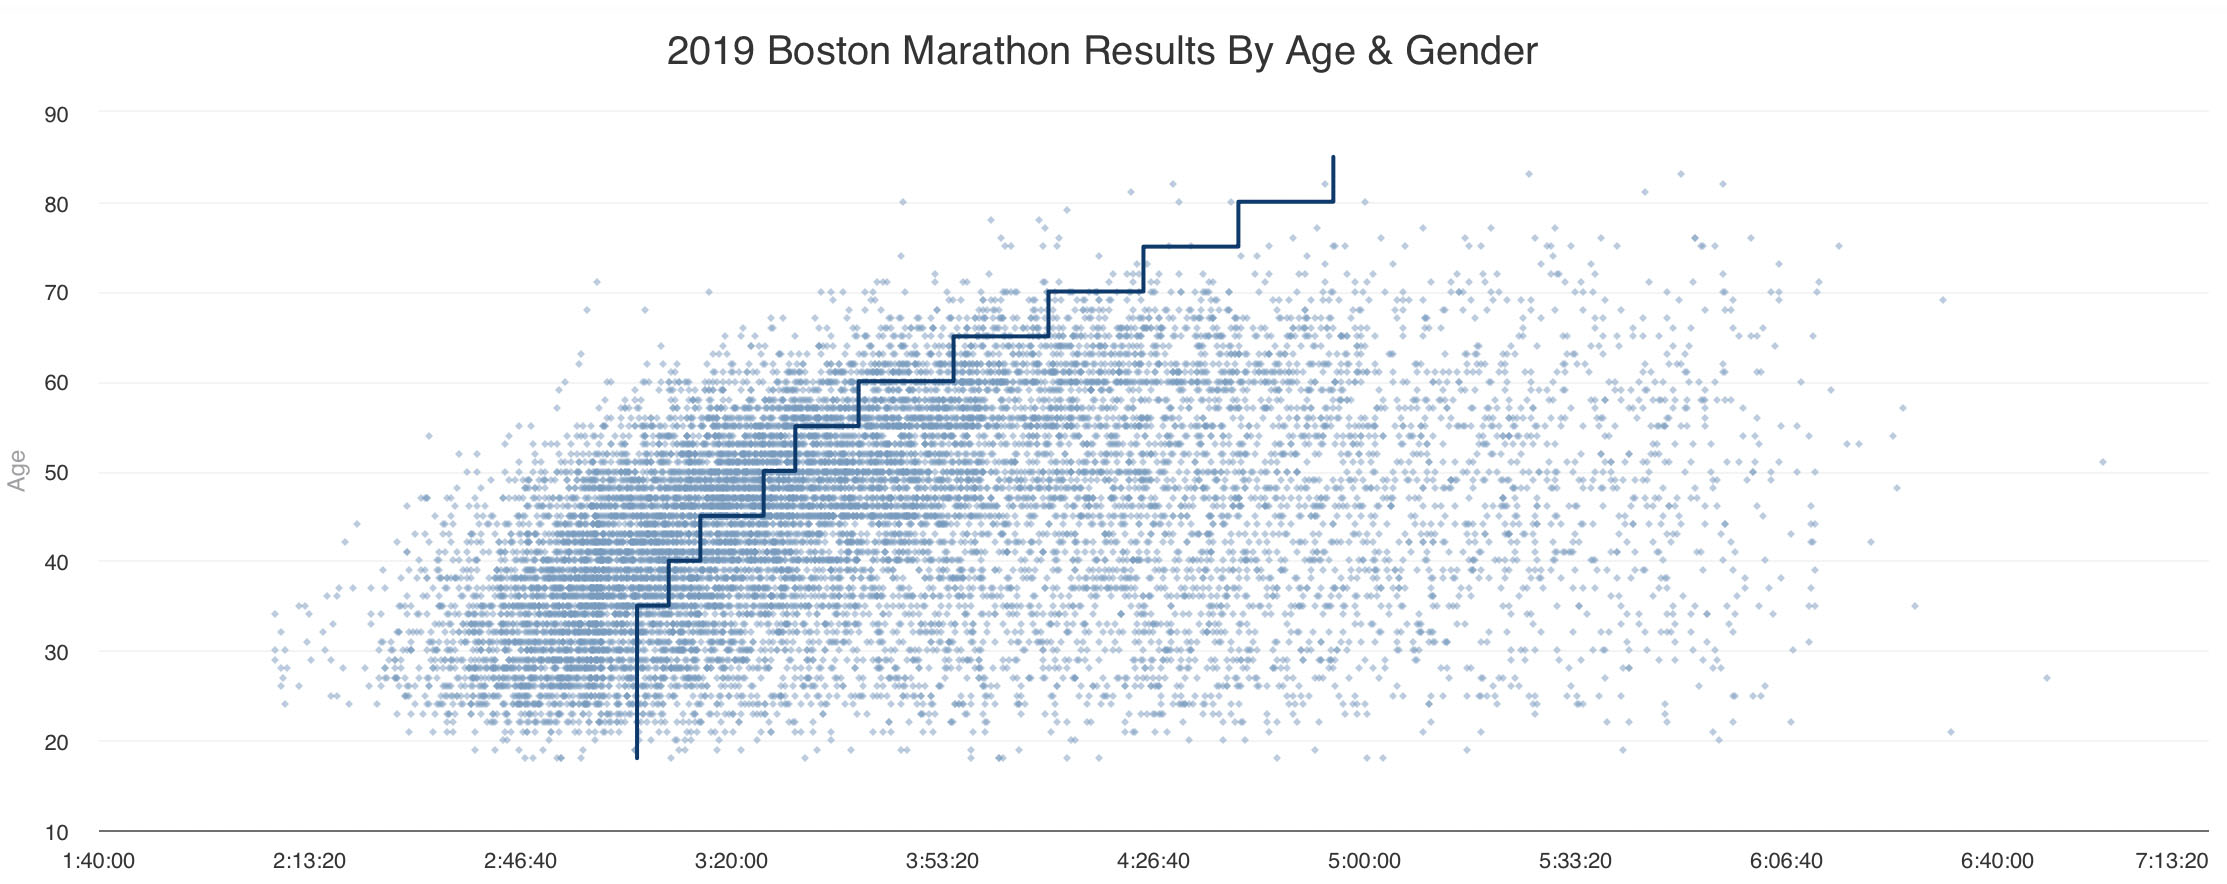
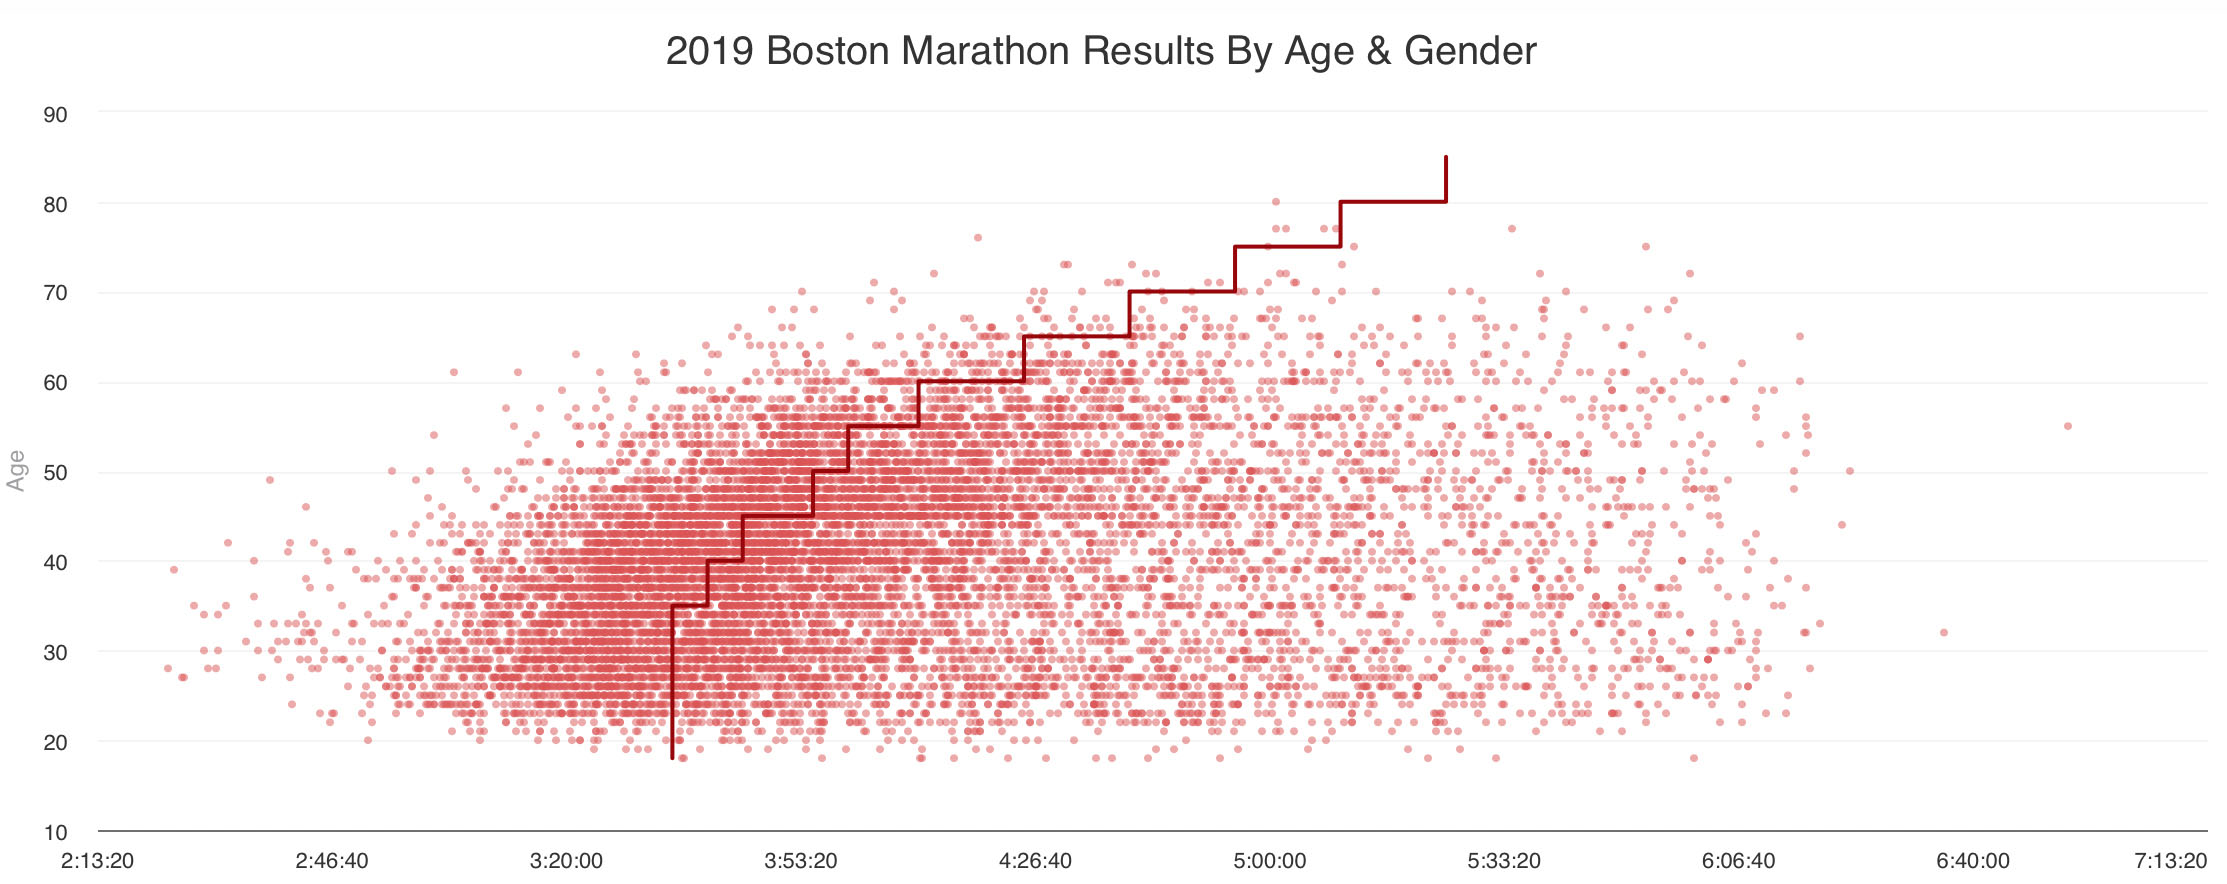
For fun, here is a scatter plot showing how 2019 runner’s finish times compared to the qualifying time (represented by the line) that they needed to qualify for the race.
If you enjoyed these data visualizations, you can explore the data in more detail on the Boston Marathon Data Project website. And if you missed the first two posts in this series, check them out below.
Part 1: Women, men, young, and old: What can we learn from the data about how to qualify for Boston? Part 2: Why is the Boston Marathon So Slow?
If you enjoyed this analysis, I am writing a book called, User Zero and I invite you to join my mailing list so you can be at the starting line when the gun goes off. Stay creative.