
One of the best things about being a designer for fitness technology products is seeing the success of athletes who achieve their goals. From 2014 to 2019 I designed products for coaches, runners, cyclists, and people training to push their bodies to new limits. At TrainingPeaks I built a marketplace that connected athletes with coaches. At Athlinks I designed tools that let racers claim their race results and build performance profiles where they could share their success with friends. At Stryd, the makers of the world’s first running power meter, I created the look and feel for their app and website. I designed community running challenges for Run the Edge, and a training app for Runcoach.
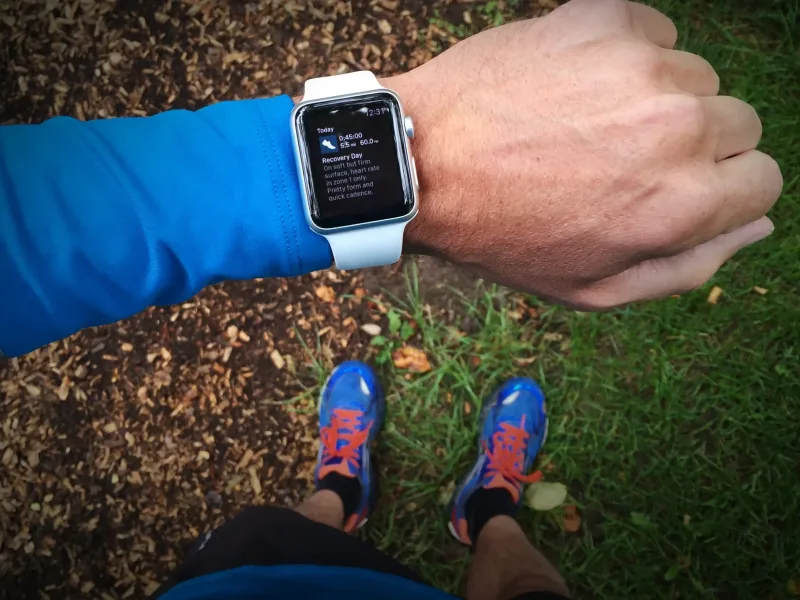
TrainingPeaks on Apple Watch
During these years, I was “eating my own dogfood” as they say. By using the tools that I was helping to create, I transformed myself from a couch potato into a Boston-qualifying marathon runner. Being a designer, and looking for ways to flex my data-visualization muscles, I dug into the numbers to find the story hiding in the data of the Boston Marathon’s 121-year history. The result was The Boston Data Project, a four-part study, an interactive tool with a placement calculator, and an open dataset.
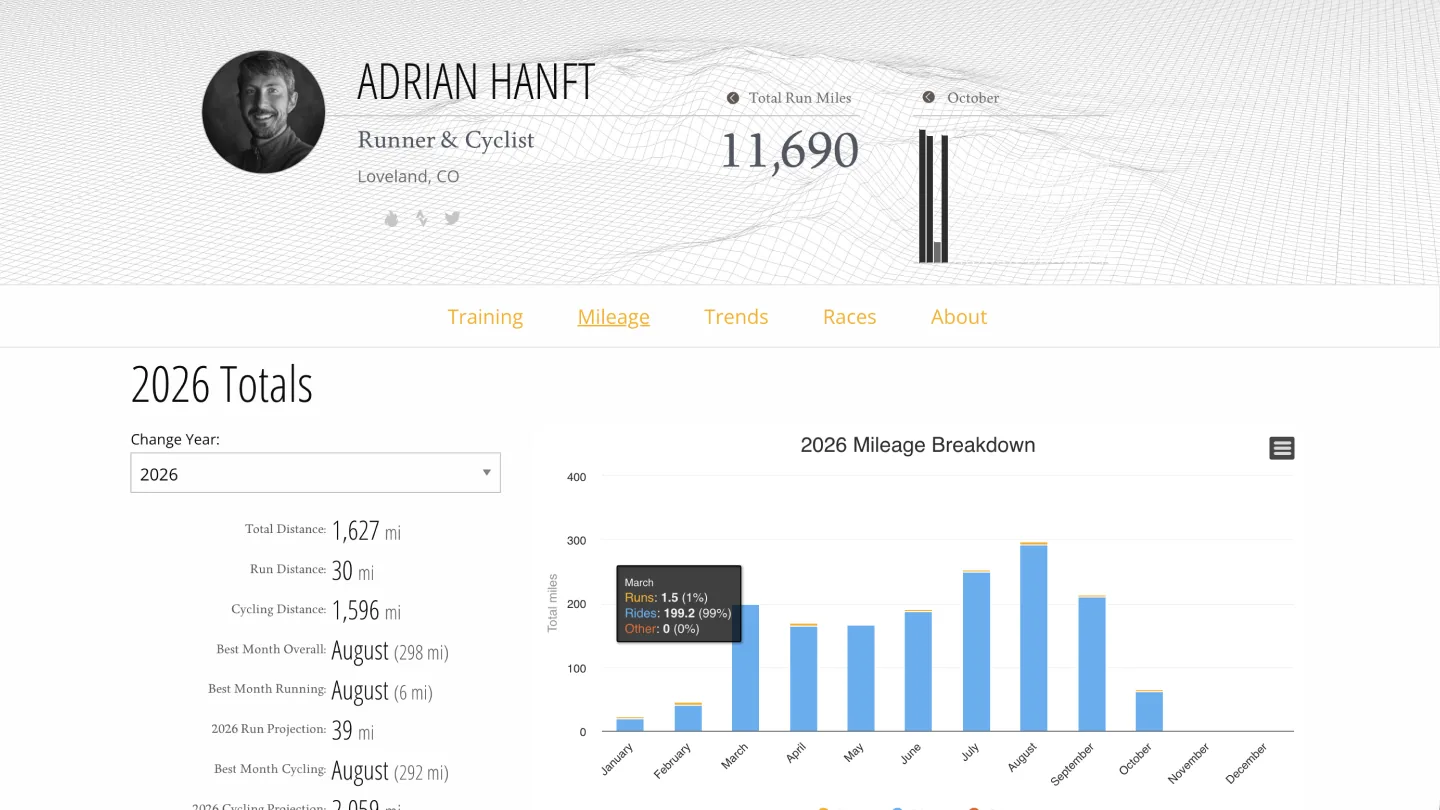
As a tech device nerd I love the wearables, health trackers, and software that the fitness industry produces. This passion is what fueled another side project, Tread1st.com. This website syncs all my runs and rides automatically from my Apple Watch every time I complete a workout. It’s like my homebrew version of Strava, a playground where I can view maps, analyze trends, and track my training. So far I’ve logged over 11,600 running miles and 13,400 cycling miles with this tool.
Here are some highlights from my 5 years designing for fitness technology products:
TrainingPeaks (2014–2016)
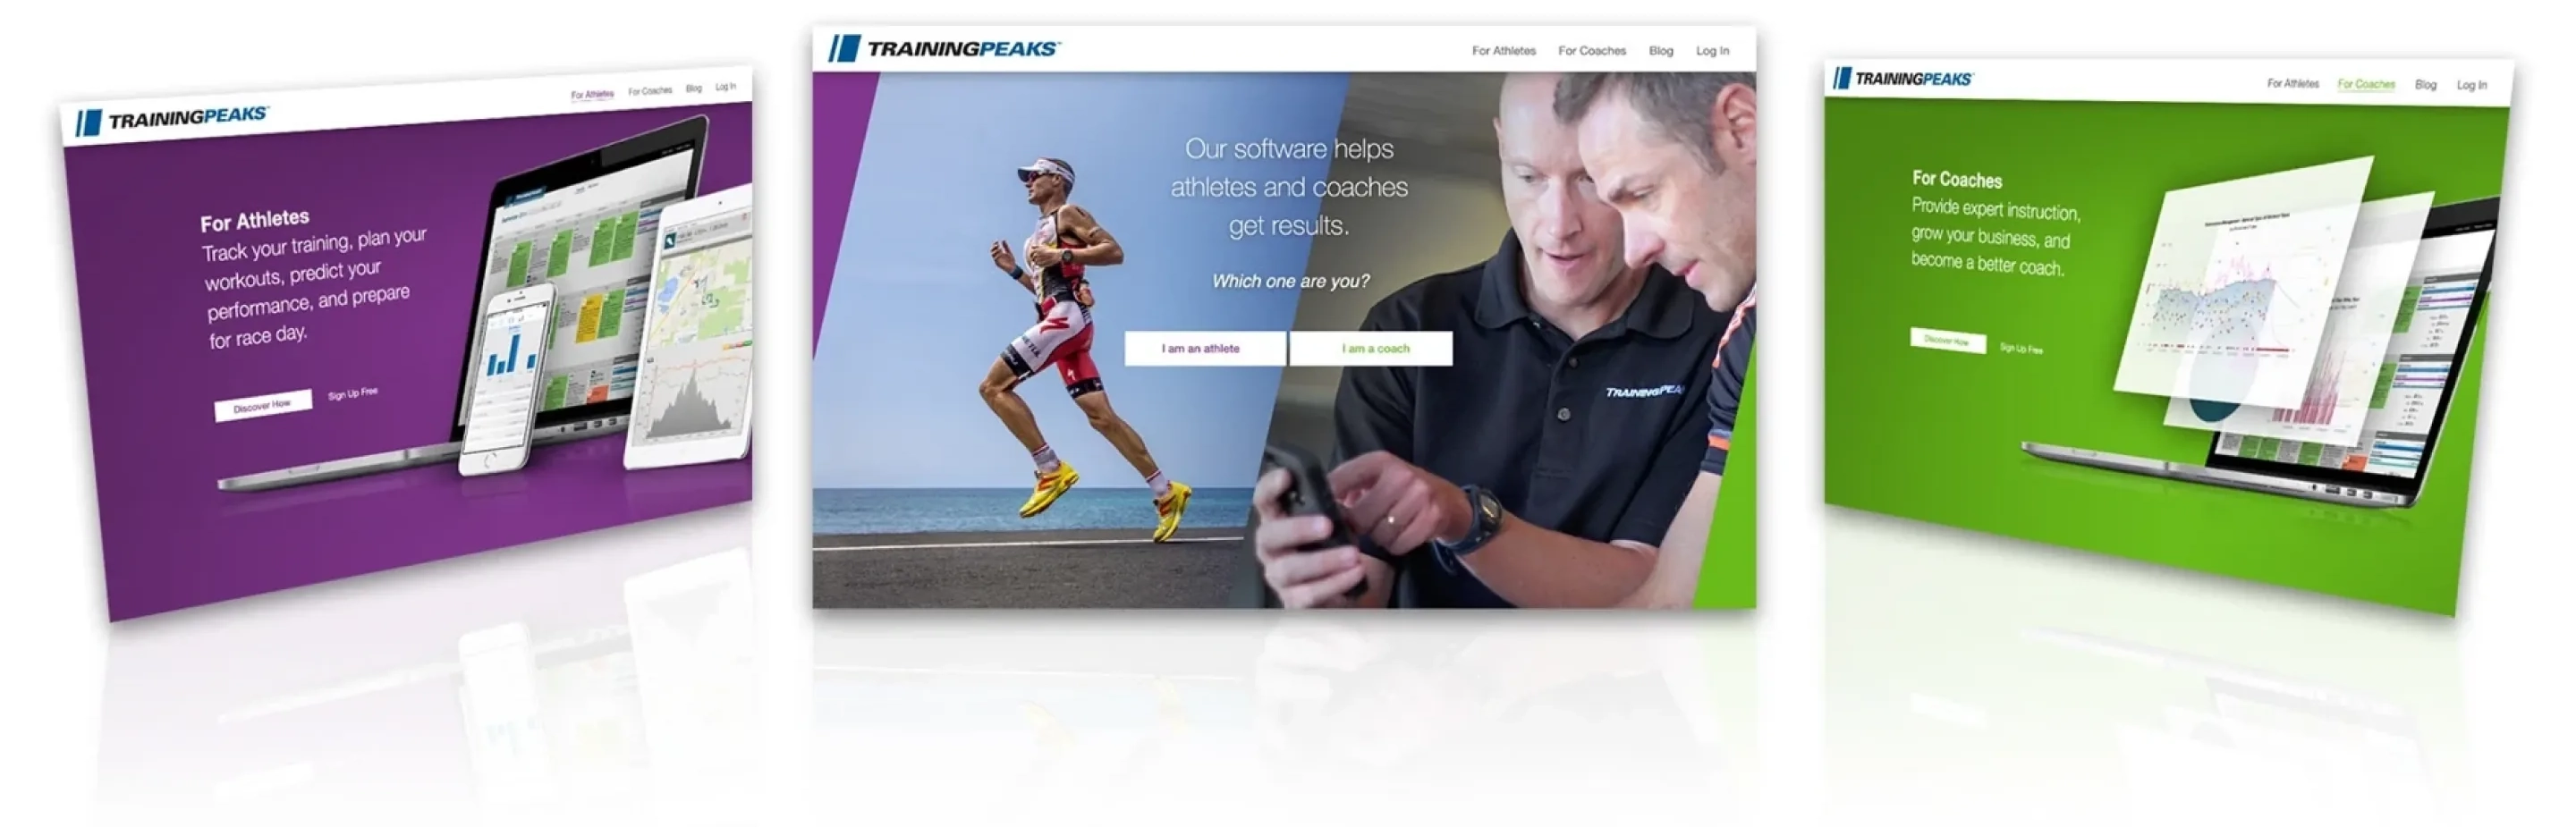
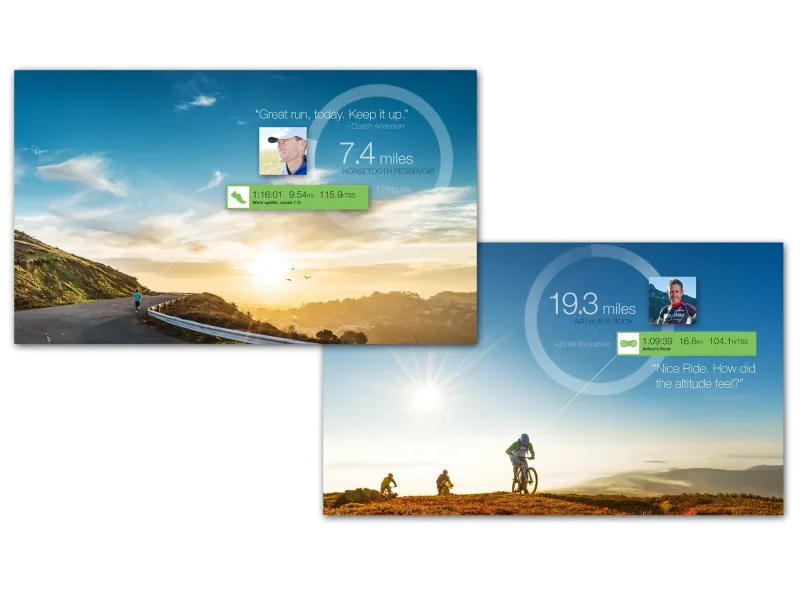
Coaches are the key to the TrainingPeaks ecosystem: when they succeed, they bring more athletes into the system. As product owner and lead UX designer of the Coach Marketplace, my goal was to make coaches the heroes of the platform. We built profiles for 1,500+ coaches and replaced a location-first search with filters for what my research showed that athletes actually look for. I also designed and built a social media tool called #ThanksCoach, which athletes used to make more than 5,000 thank-you images for their coaches.
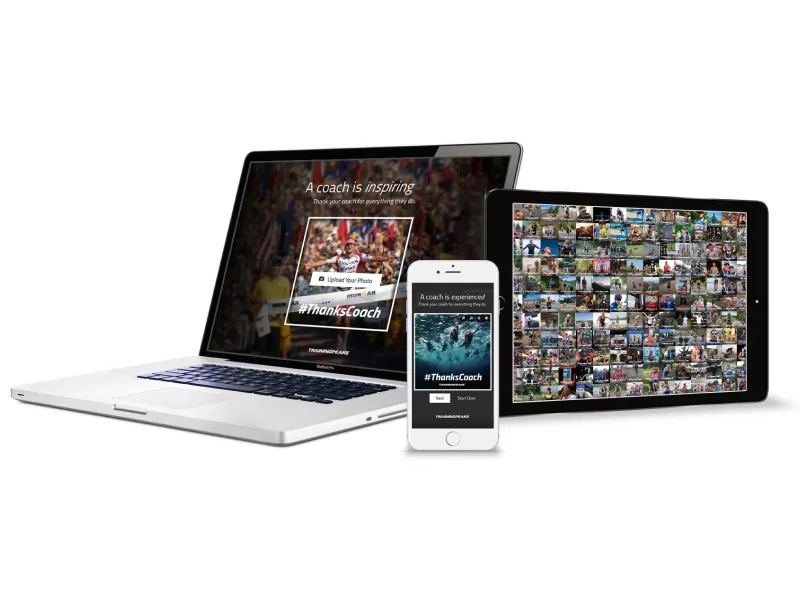
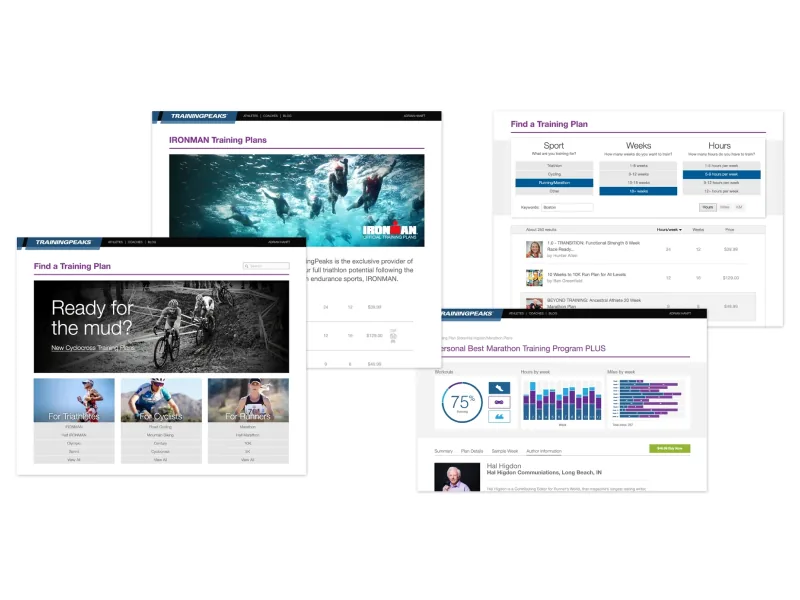
The marketplace was a long project, from 2014 to a launch in early 2016, with a team of four to seven people and stakeholders across the company. We kicked it off with a persona exercise where each team member role-played a type of user and wrote user stories, which pushed us past a better search page toward an API so coach information could appear wherever it helped an athlete. I designed the coach profiles so that the more a coach took part in TrainingPeaks programs, the more they could unlock on their page. The TrainingPeaks case study follows the project from research and planning to launch.
Athlinks (2016–2018)
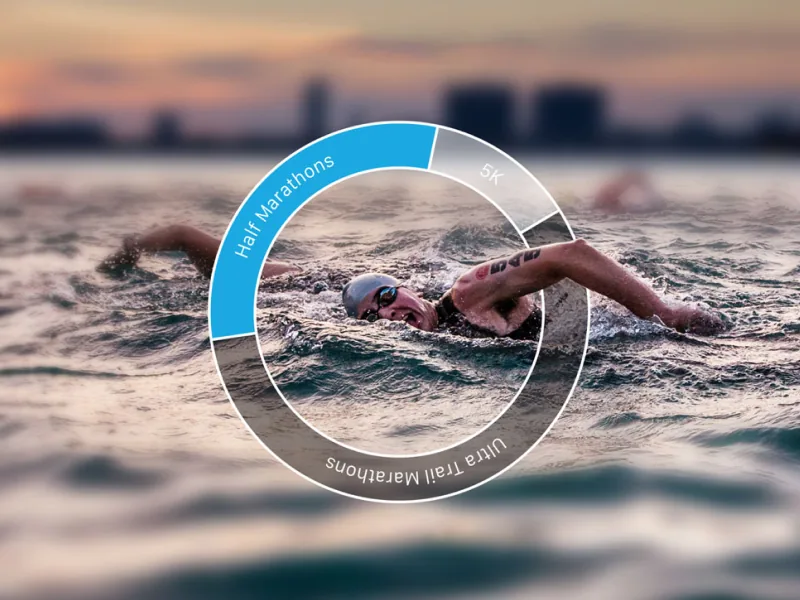
Athlinks is the world’s largest collection of race results. For the 2017 redesign I created a new visual language built around a “dial” that represents progress. As part of a user research trip I tested designs in Leadville, Colorado on race day where we observed athletes claiming their results in real-time through our app.
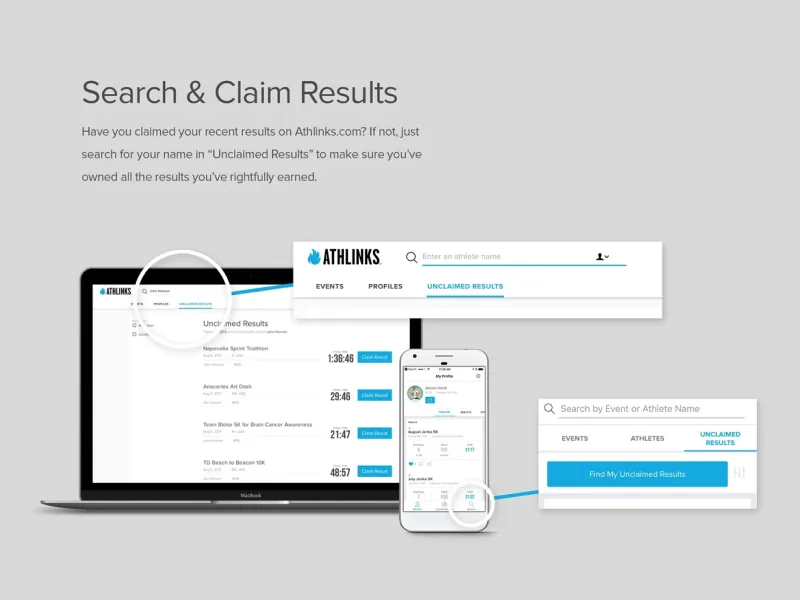
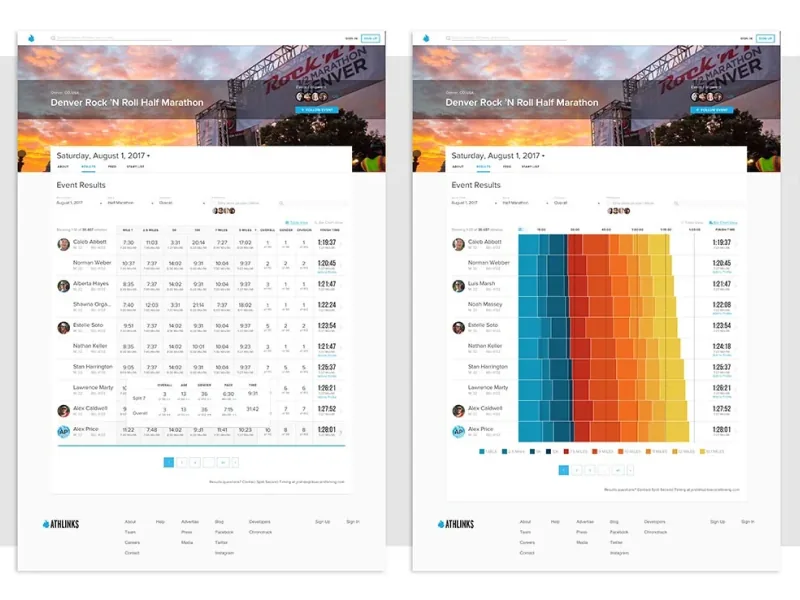
Split times were one of the trickiest problems. Nobody in our industry displayed that data, so there were no patterns to borrow. I tested a clickable prototype of a table against two visual versions, and while most users leaned toward the table, several were drawn to the charts. The design shipped with the table as the default and a toggle to the chart view. My Athlinks case study covers this test, the three racer personas that guided our decisions, and the living style guide that kept a small team consistent.
Stryd (2017–2018)
I bought a Stryd power meter in early 2017, was disappointed by the complexity of the app interface, and offered Stryd my design services. Cadence, vertical oscillation, leg stiffness, and ground contact time can intimidate runners. My answer was a badge for a runner’s critical power: one number that new runners find intriguing but not intimidating, and experienced runners want to dig into.
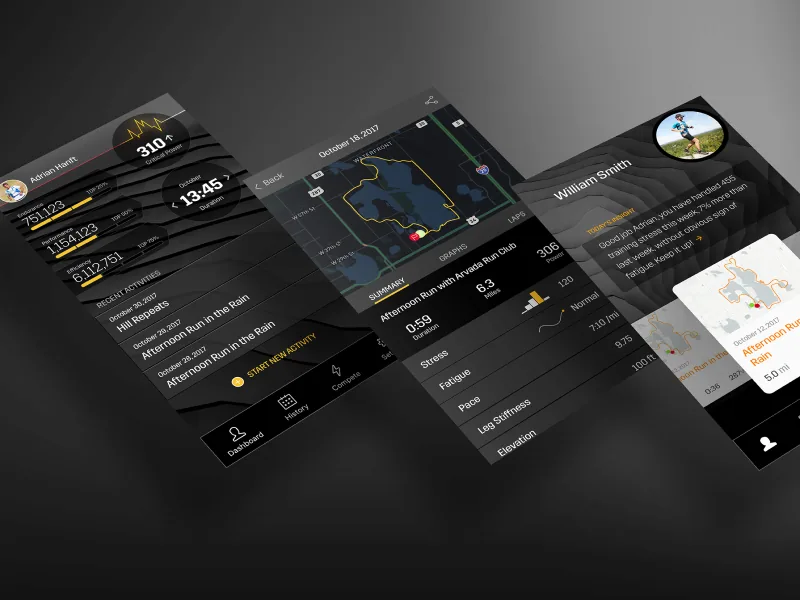
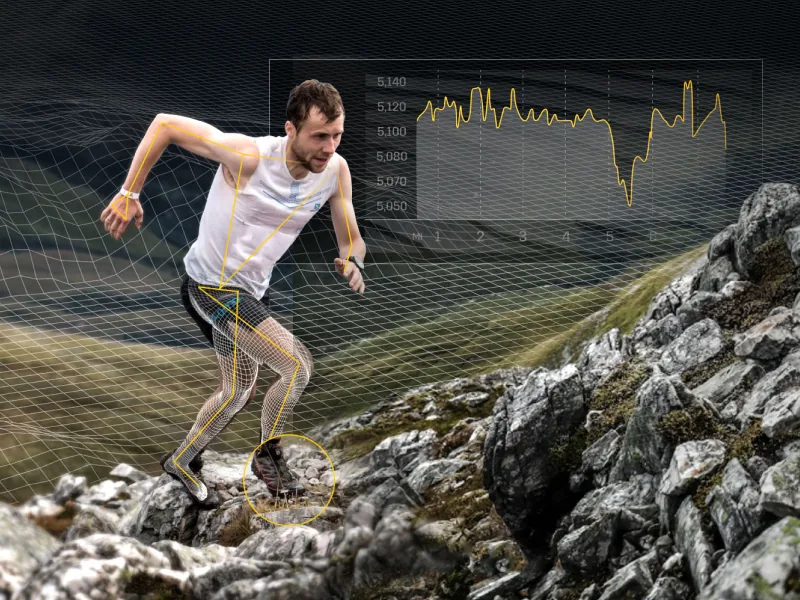
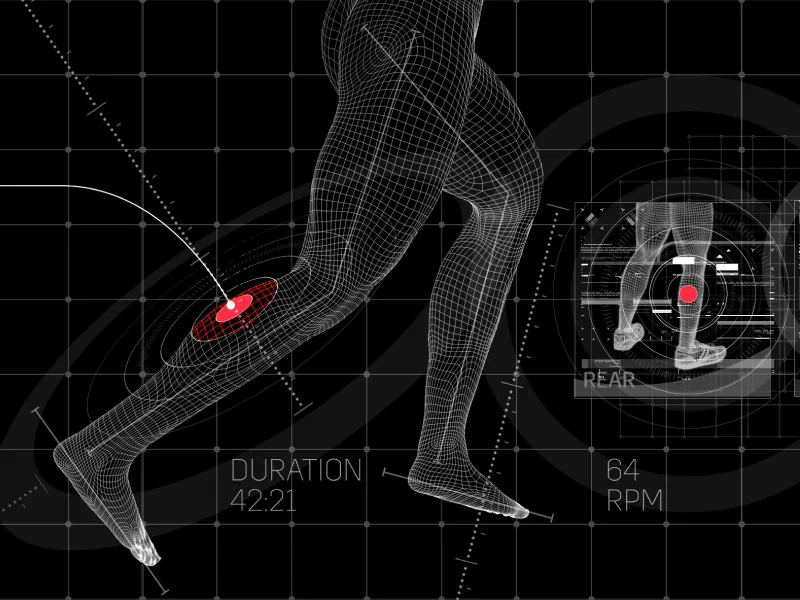
The app was the bigger challenge: presenting dense running data on a small screen. I explored several visual directions and dashboard layouts to find the right hierarchy and density, then reviewed them with customers and stakeholders. The Stryd case study walks through both projects, from website graphics that explain how the power meter works to the app’s charts.
Run the Edge (2018)
Run The Edge is a community challenge project that motivates runners to “Run the Year” by logging 2,018 miles in 2018. To visualize this monumental task, I designed the Amerithon dashboard with an empty map of the United States that fills with color as you log miles.
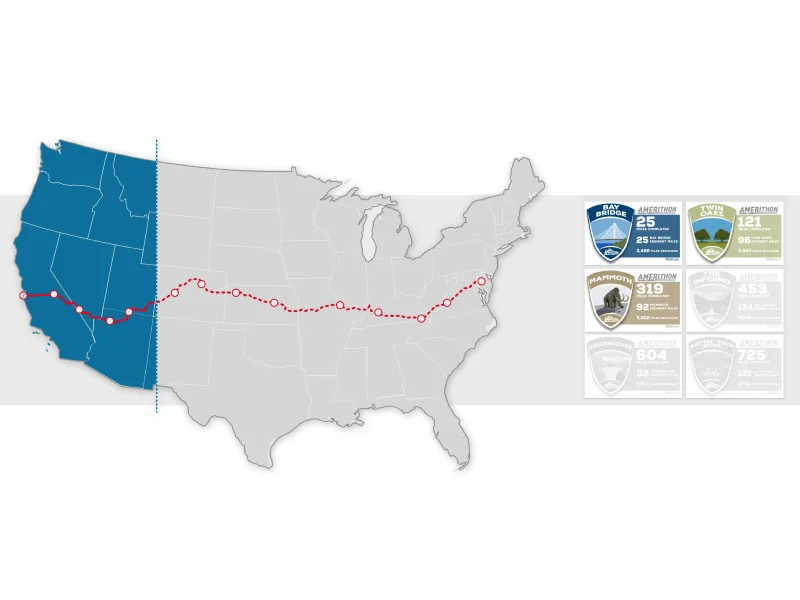
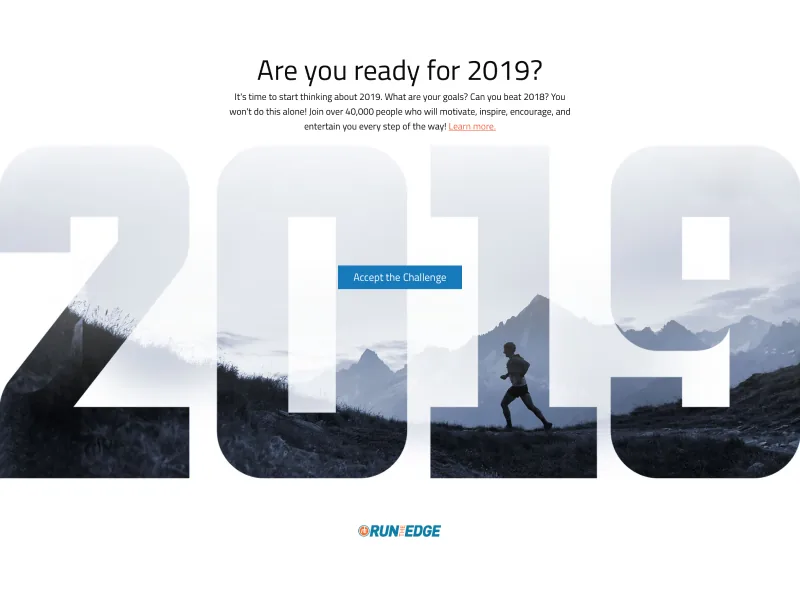
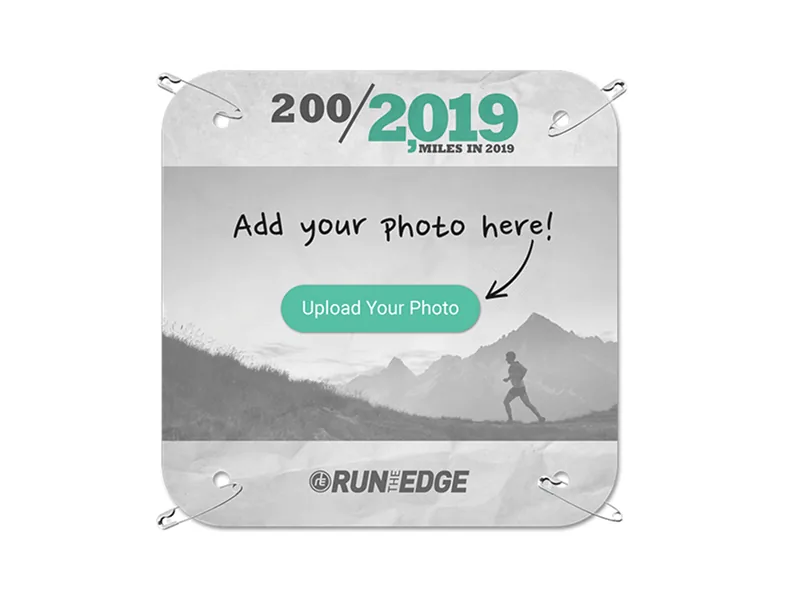
The first thing I addressed was actually a brand problem. Many Run the Year participants didn’t know Amerithon existed, and some didn’t know the parent brand, so I recommended bringing every challenge under the Run the Edge website with one account and one login. I also built HTML components for the app that doubled as a pattern library and made quick HTML prototypes possible. The Run the Edge case study covers the consolidation, the animated map, and what came next.
Runcoach (2018–2019)
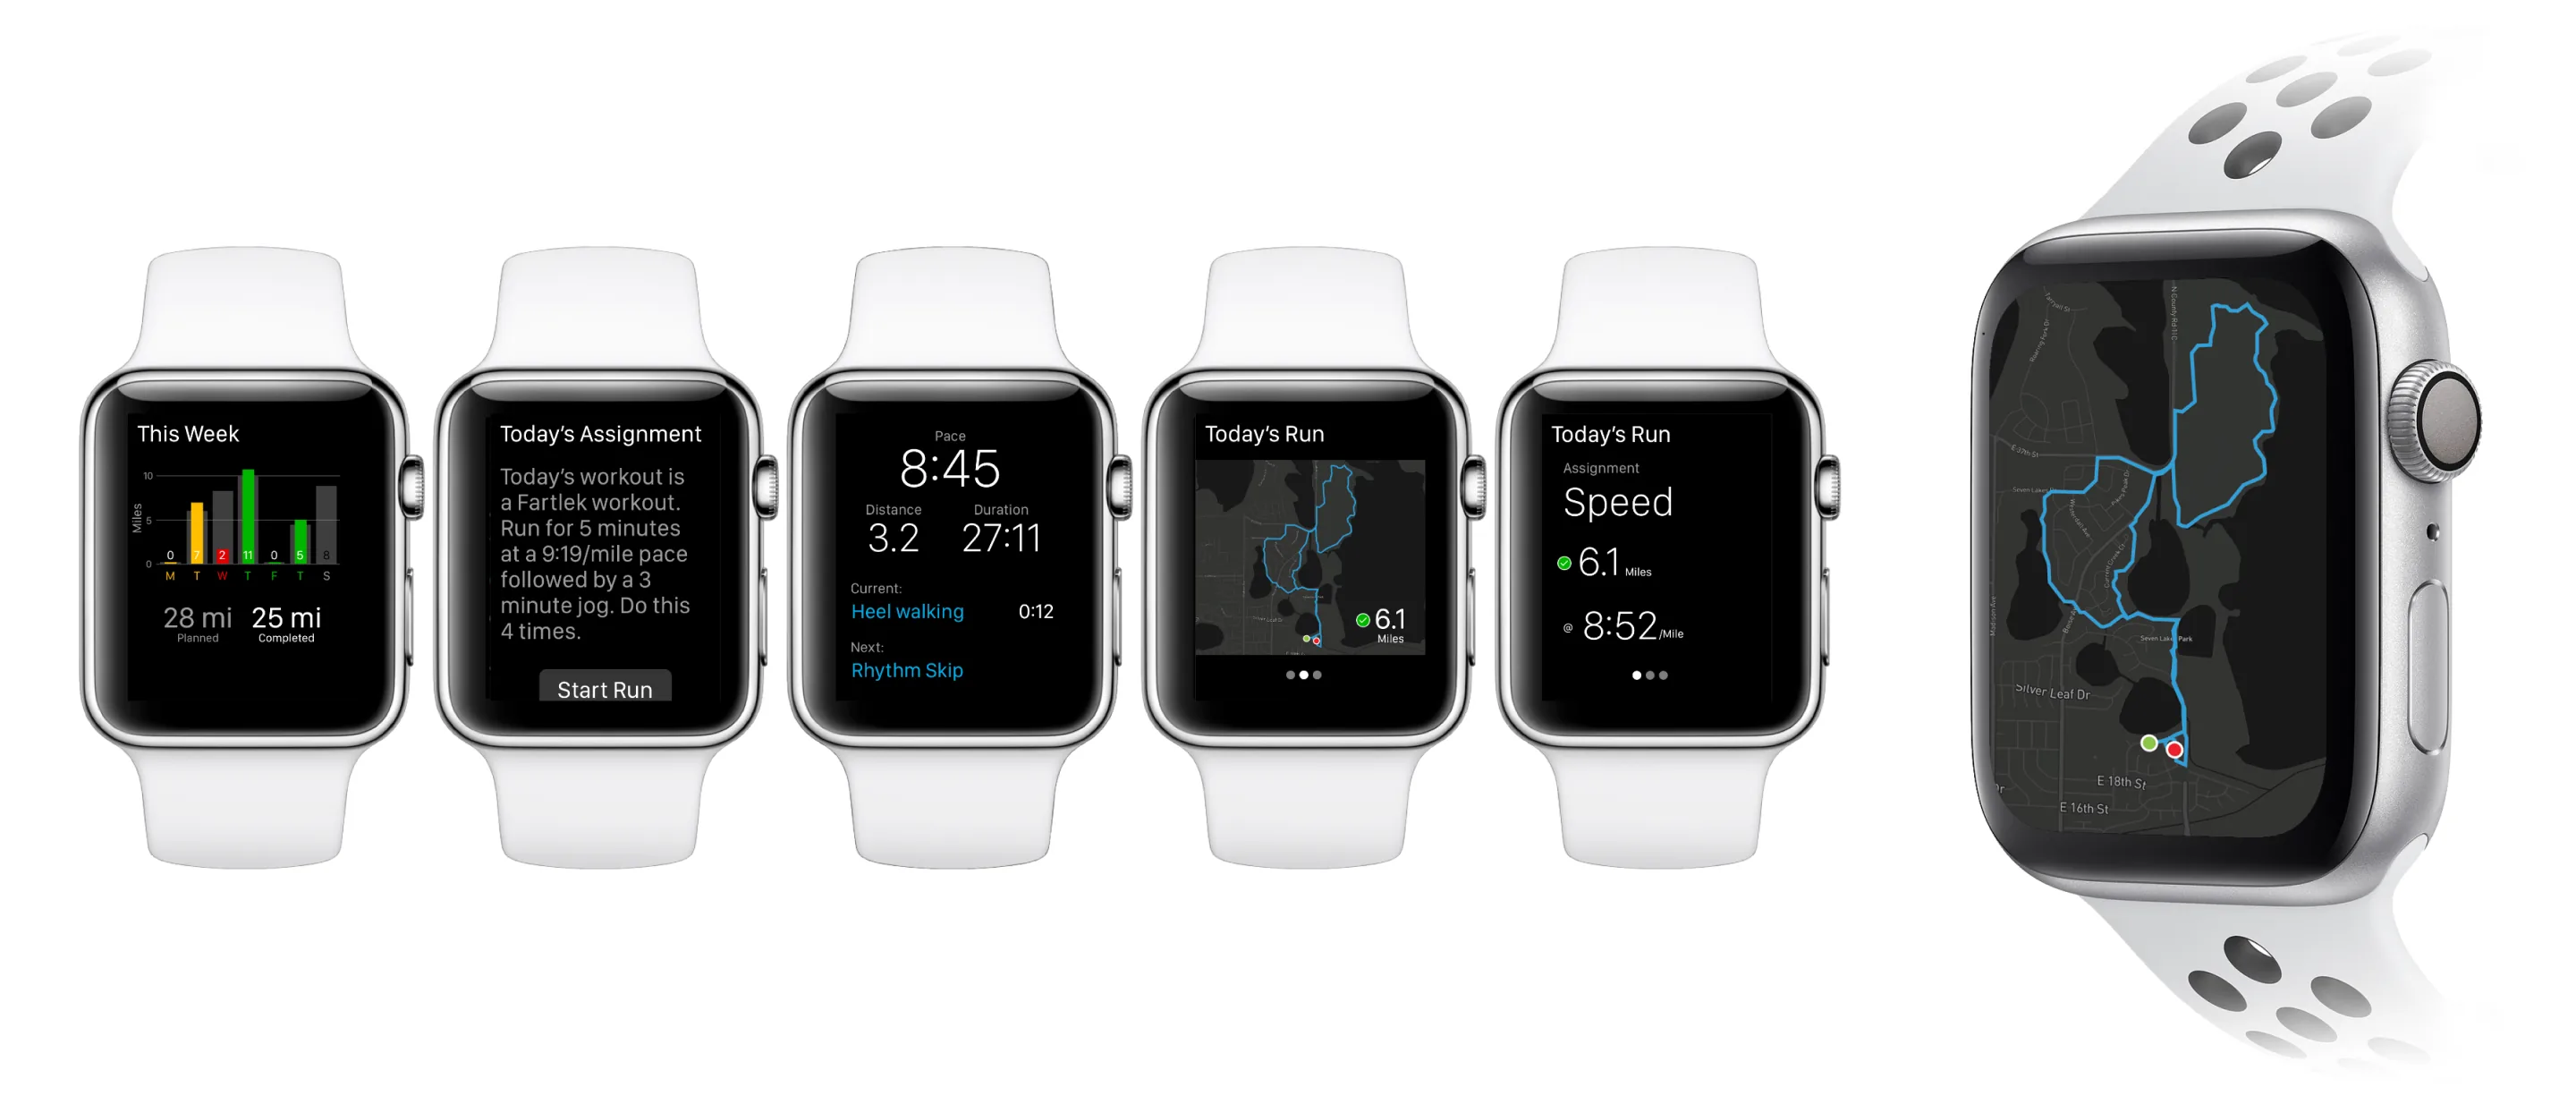
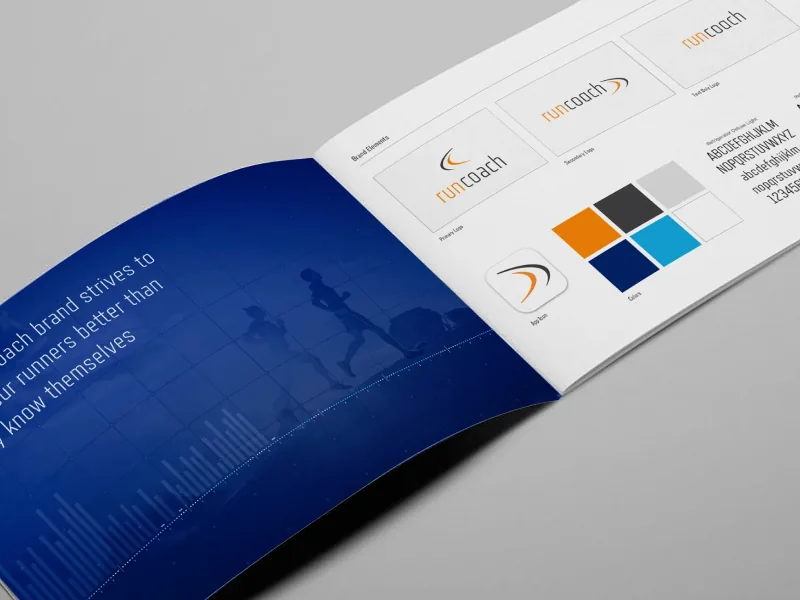
As the sole designer, I led Runcoach’s move from a paywall to freemium. To make the paid tier worth it, I increased the visibility of our on-staff coaches inside our app. Throughout the onboarding, email, achievements, and support a real coach’s voice was a key part of the tool.
To keep my own runner’s bias in check, I developed a panel of a dozen of our most passionate users who I could reach out to for beta versions of our product and to stress test new ideas.
I turned support tickets into short user stories to rally the team, a method I wrote up as Lightweight Customer Journeys.
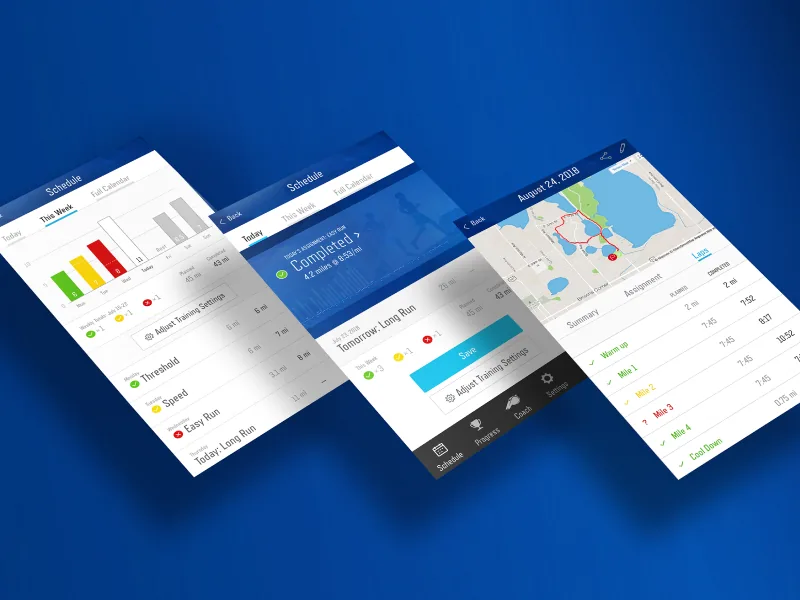
The biggest feature I redesigned was the training calendar. I studied more than 20 apps, shared the patterns with the team, and set aside the conventional grid in favor of three views: Today for the day’s workout, Week for recent and upcoming runs, and Month for overall training load. We shipped a first version and kept iterating toward that vision. The Runcoach case study tells the full story, from the freemium transition to the user journeys and the calendar.