
I started working at Nutrien Ag Solutions in 2019 after half a decade working in fitness technology. The shift to agriculture was a welcome new challenge. Surprisingly, many of the ideas in these seemingly different industries were roughly equivalent. Training apps rely on making a plan, gathering data, measuring progress, and executing on race day. In agriculture the formula is similar but instead of a race, the goals are measured at harvest time.
I started out as a contractor for Nutrien then was brought on as a Senior UX Designer. Eventually I served as UX Manager, and I helped grow the design team from 7 to 15 designers and researchers. We established a culture of trust through formal critiques, retros, hackathon participation, and a shared design system.
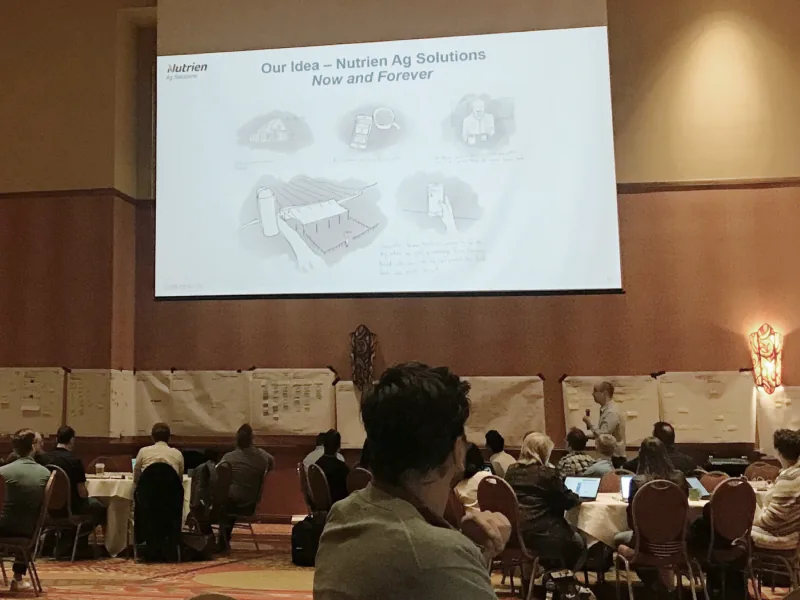
Big room planning
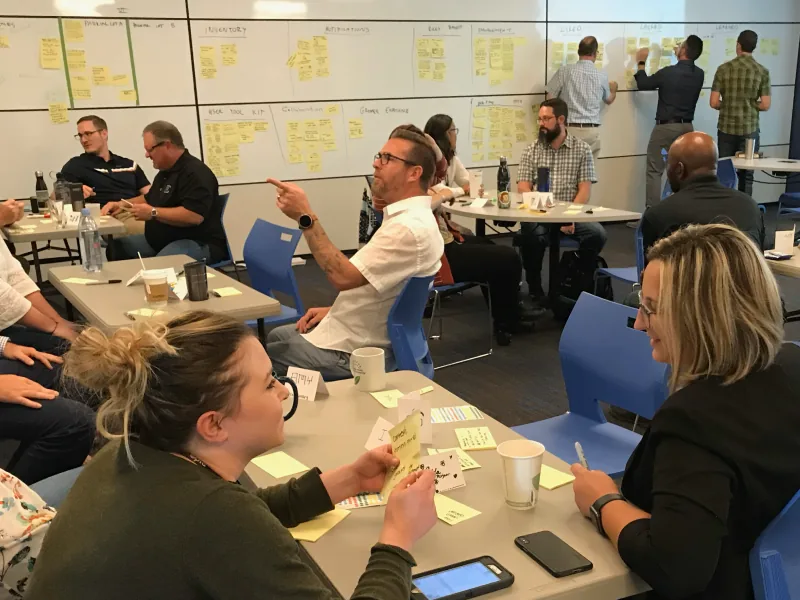
Team brainstorm
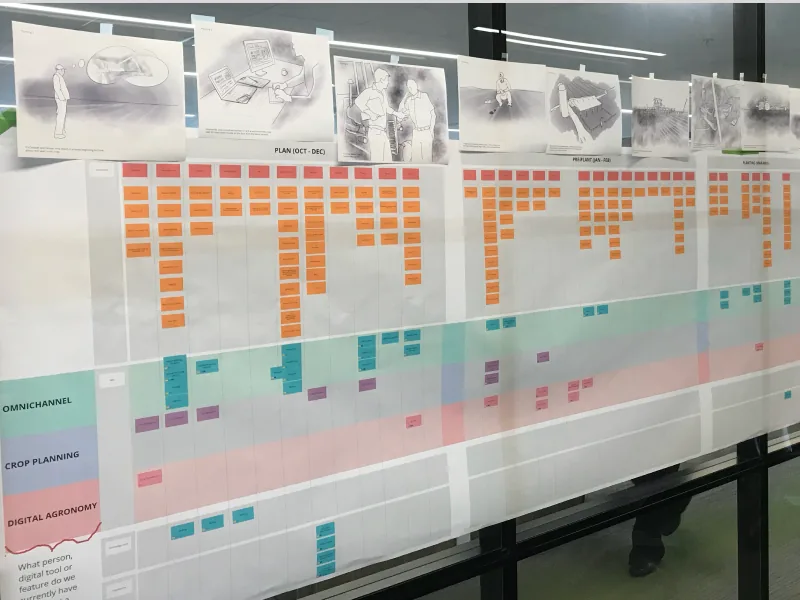
Journey map, storyboards, and sticky notes
The Employee Experience Hub
The challenge I faced at Nutrien was how to modernize the tools used by Nutrien’s sales force of more than 20,000 crop consultants.
Crop consultants often know more about agronomy than the farmers they sell to, and a recommendation from one is more like a prescription from a doctor than a sales pitch. To understand that relationship I traveled into the field to see facilities in action, sat in offices listening to sales calls, and rode along with crop consultants to see how they got their job done from their trucks.
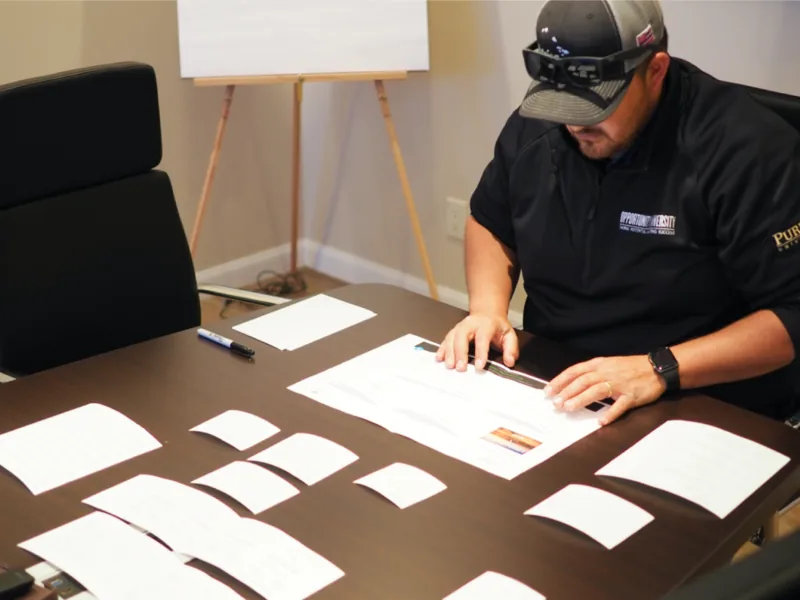
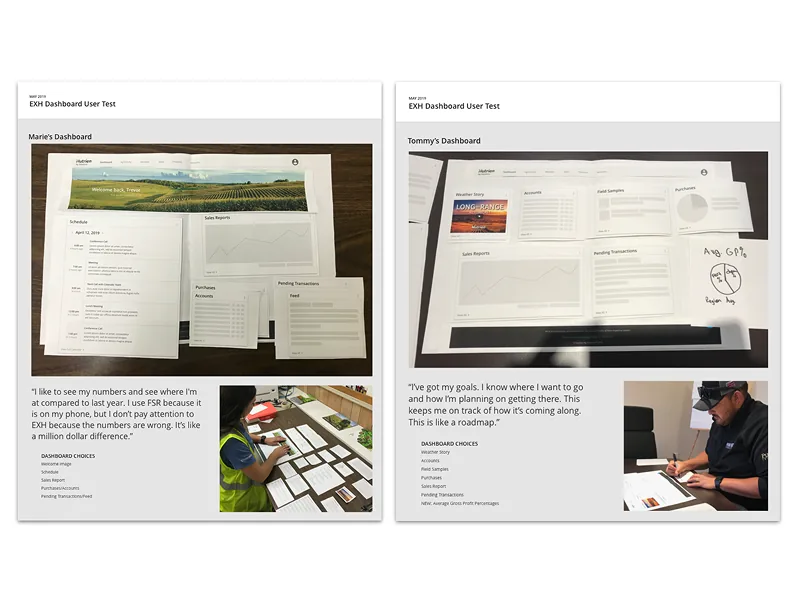
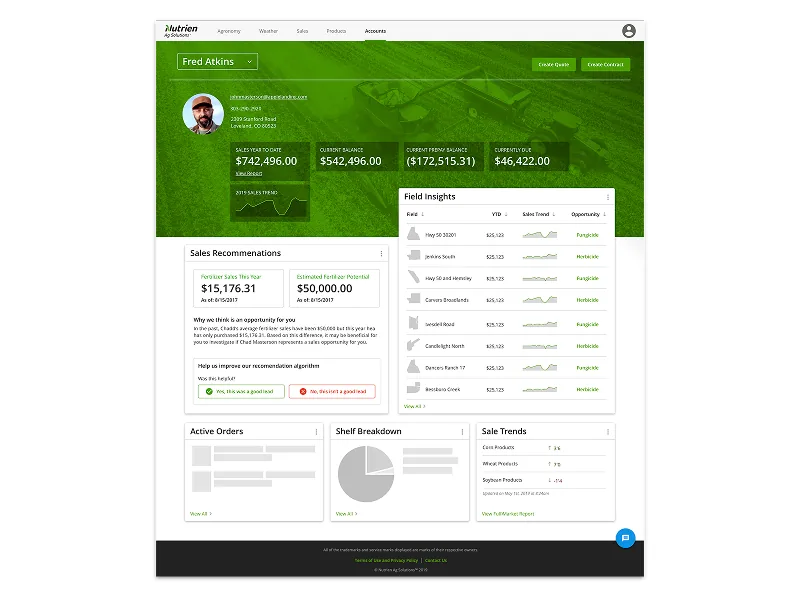
The hub is the platform crop consultants open each morning, so its first screen had to deliver something they could act on. I gave consultants paper prototypes and asked them to build their own dashboard, and the shipped dashboard used the widgets that earned their place. As the hub grew, card sorts, tree tests, and a survey with 12 crop consultants decided where everything goes.
Selling and Ordering
Early versions of Nutrien’s e-commerce platform failed because they relied on traditional shopping cart patterns. In agriculture, a sale often starts as a loose agreement to reserve product before planting, becomes an estimate based on application rates, acres, and mixture ratios, keeps changing as products become available, and is only complete after the products are applied to the field. Copying Amazon’s best practices doesn’t solve this problem so we designed new patterns. I reframed an order as “customer X needs Y of product Z” and recommended decoupling the experience from the ERP.
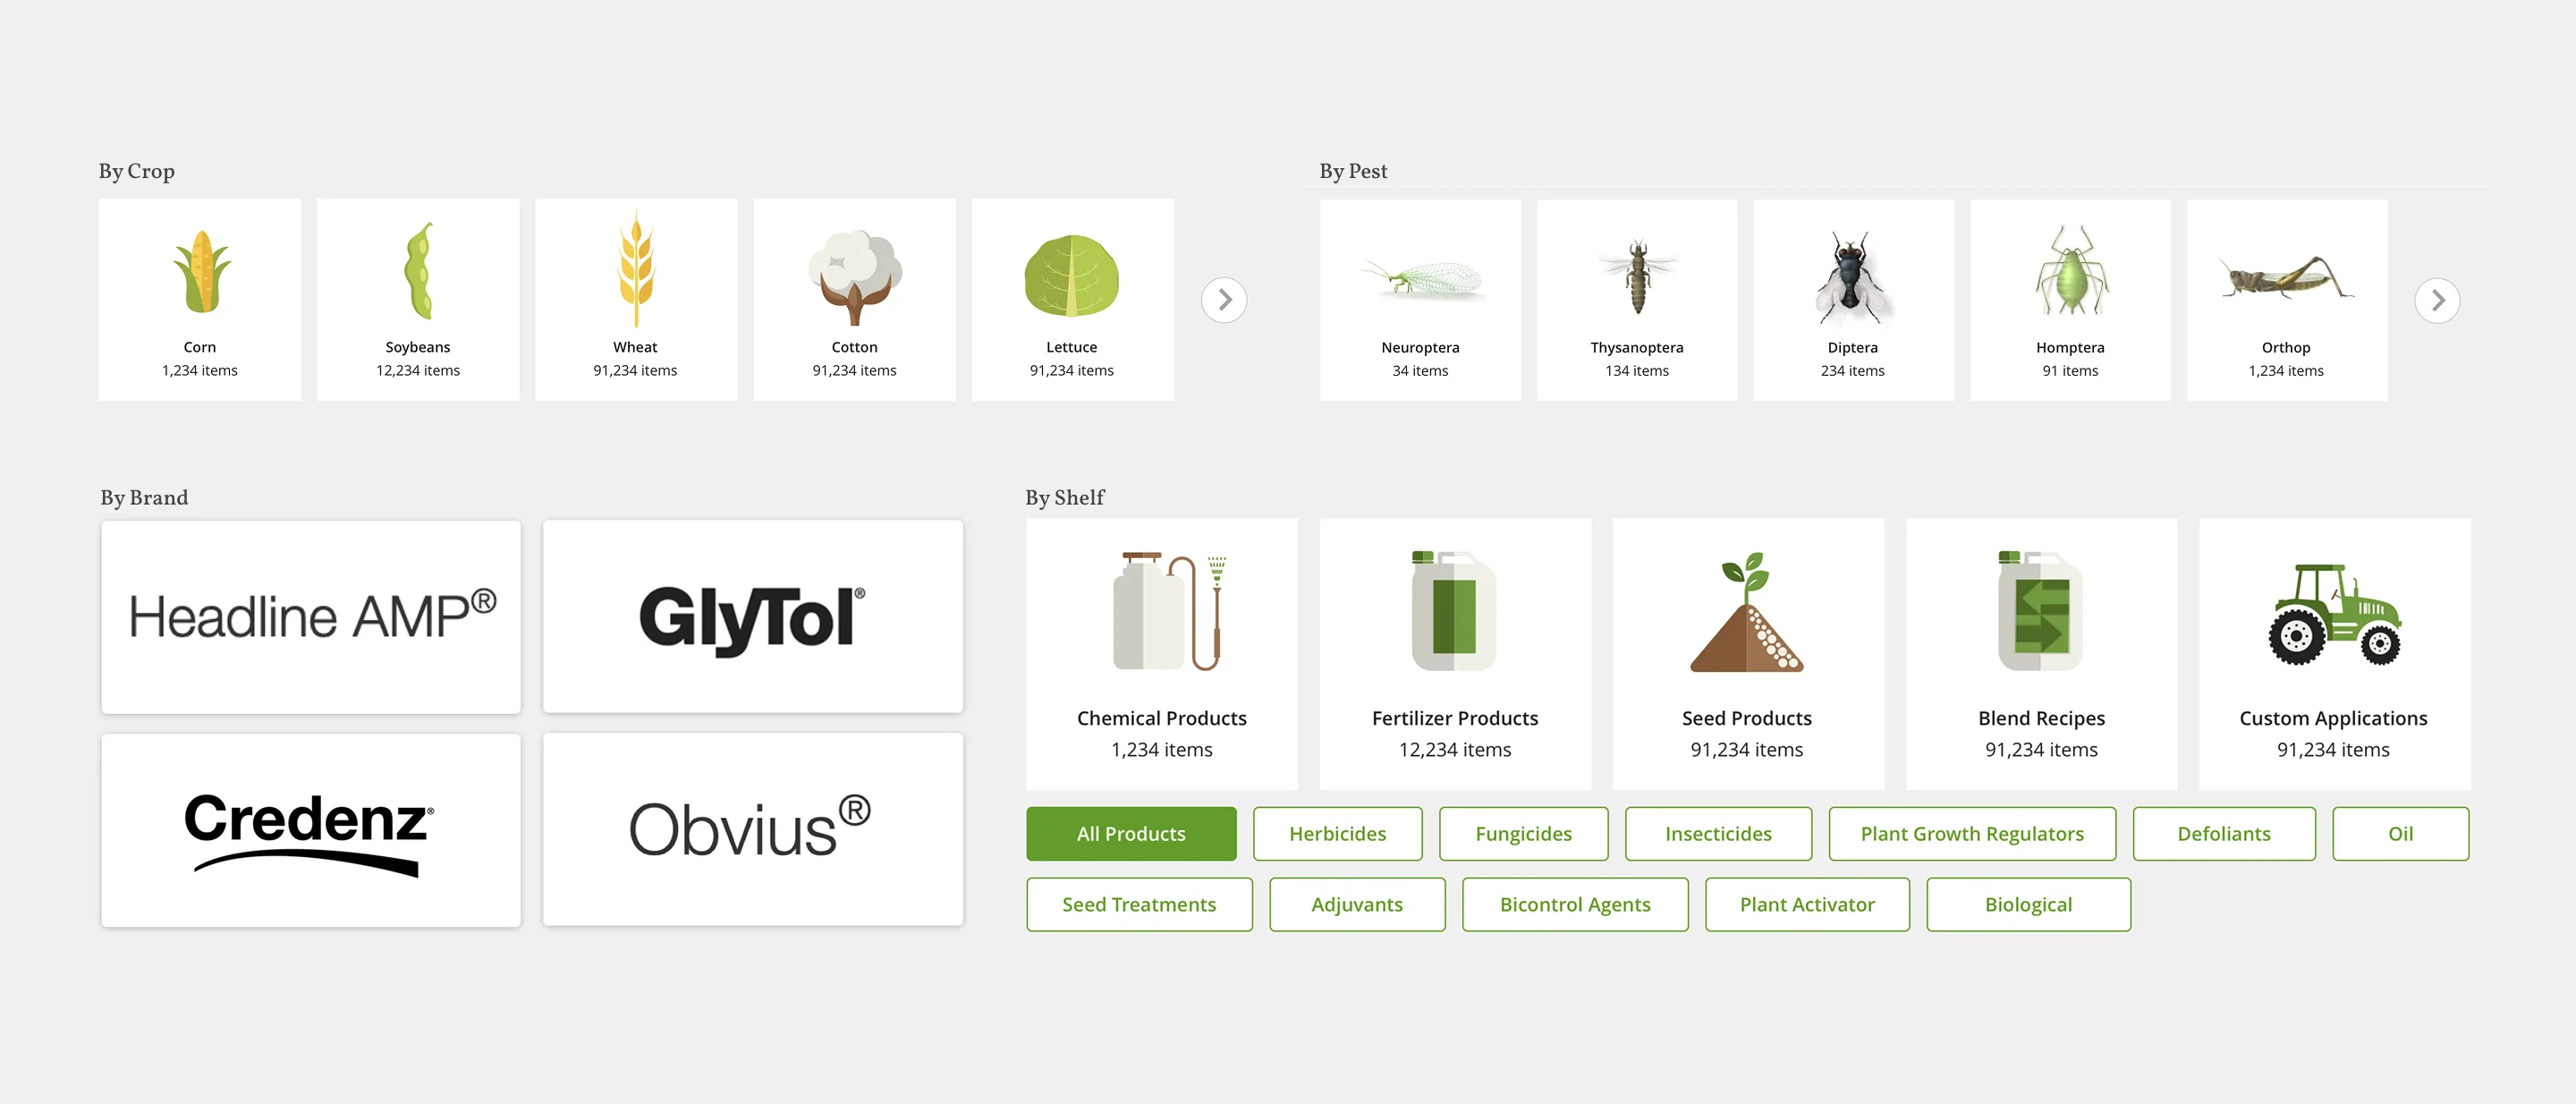
For the product catalog, design sprints with Syngenta and BASF and remote interviews with seven consultants put search first.
Field Research
Understanding farm personas requires meeting our users where they worked. I traveled to Arizona, California, North Carolina, and Indiana to observe facilities and farms in different regions of the United States.
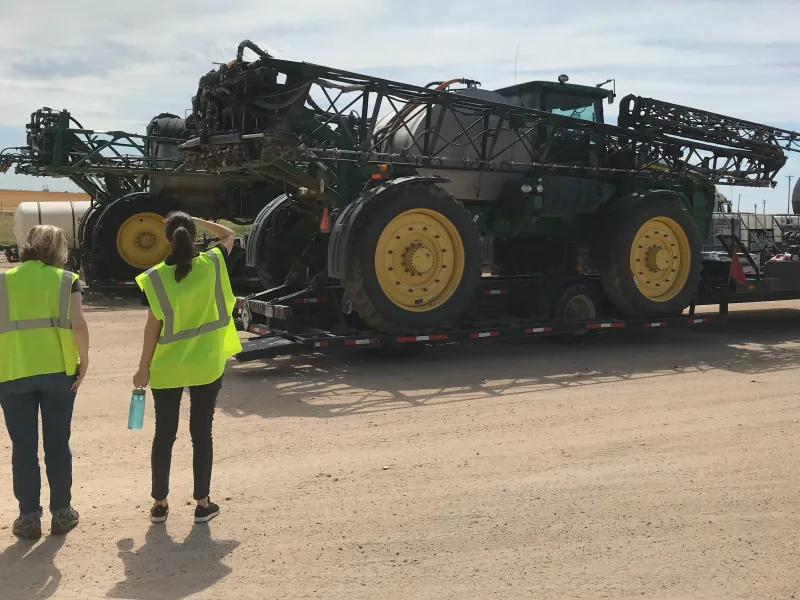
Visiting a facility
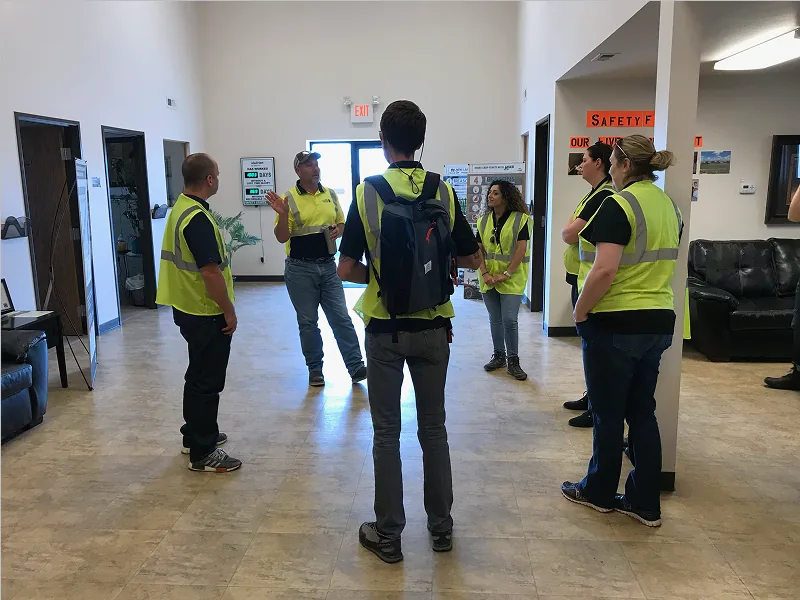
Talking with the team at a facility
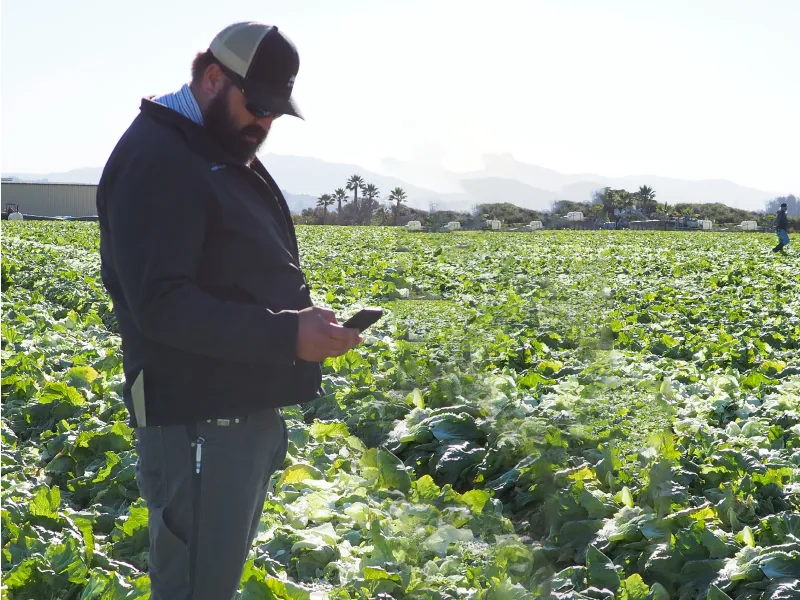
A crop consultant at work in the field
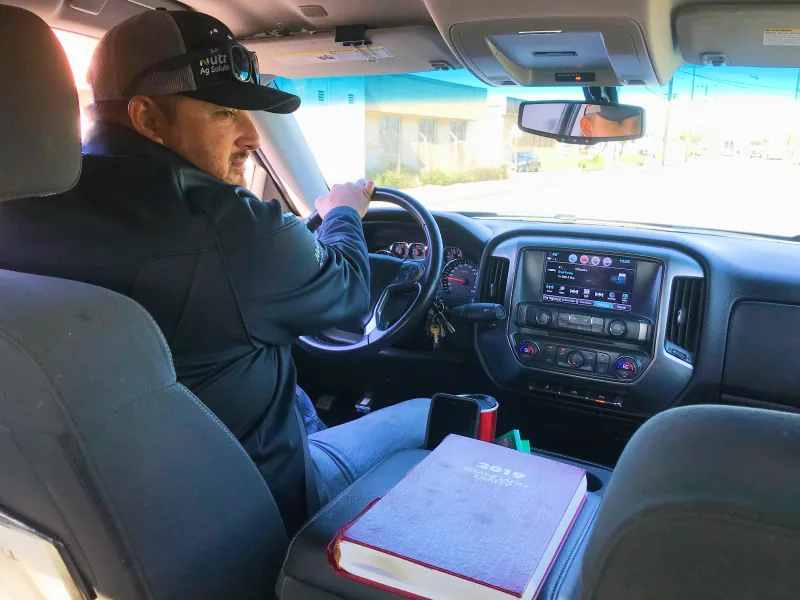
Riding along with a crop consultant
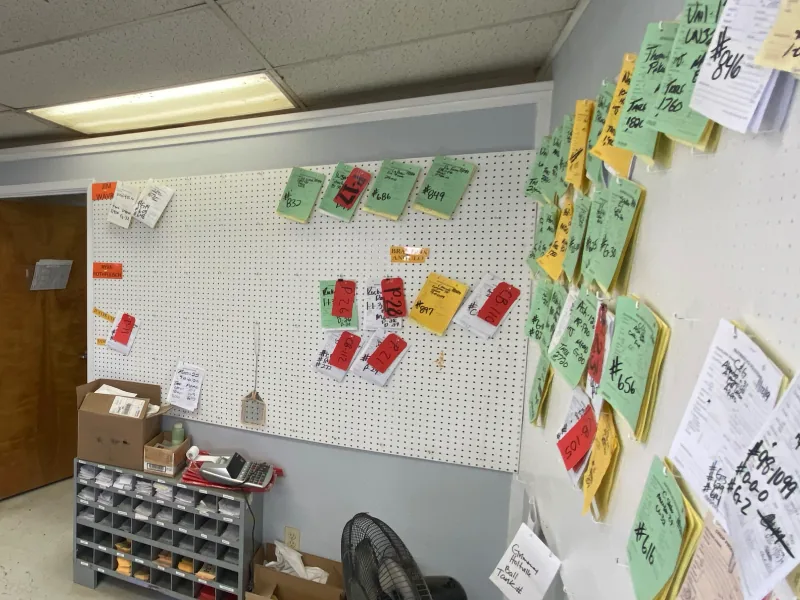
A facility’s order wall, tracking orders through fulfillment
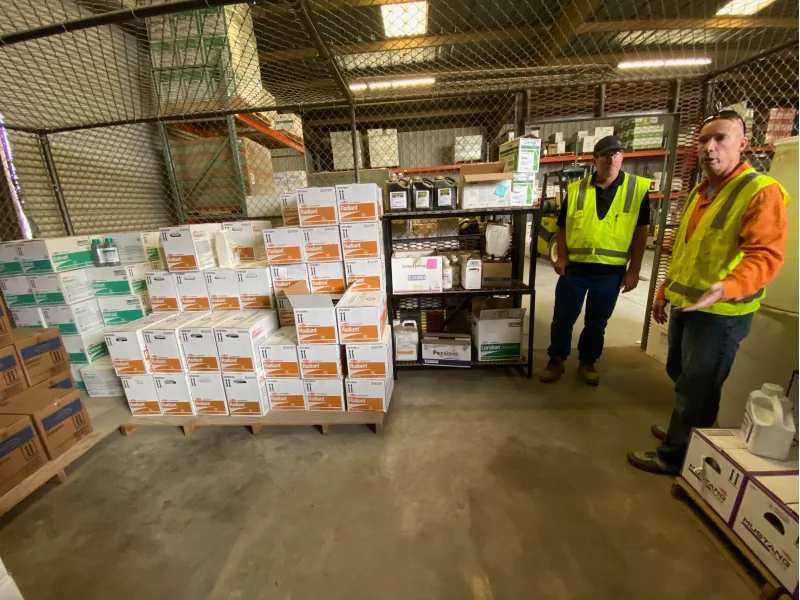
Product stock at a Nutrien facility
One of the outcomes from these research trips was based on insights from a user study I designed that allowed users to create their own dashboards. This allowed us to create useful dashboards that were informed by what users actually valued such as their accounts, sales reports, weather, and pending transactions.
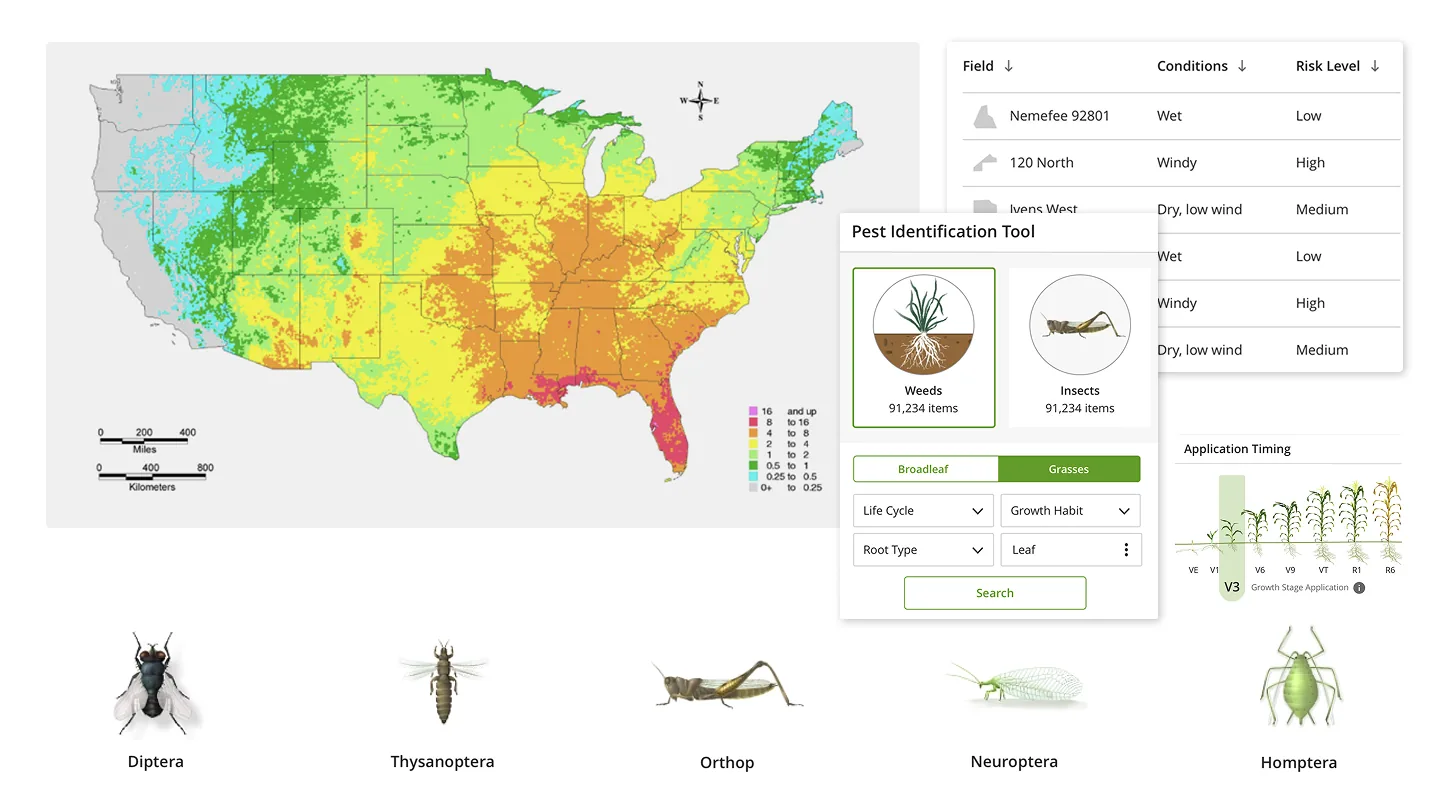
Field research also uncovered that consultants often called their branch admin instead of using our app. Realizing this, we reprioritized the mobile app for ease of use while standing in the middle of a field or sitting in a truck on the side of the road.
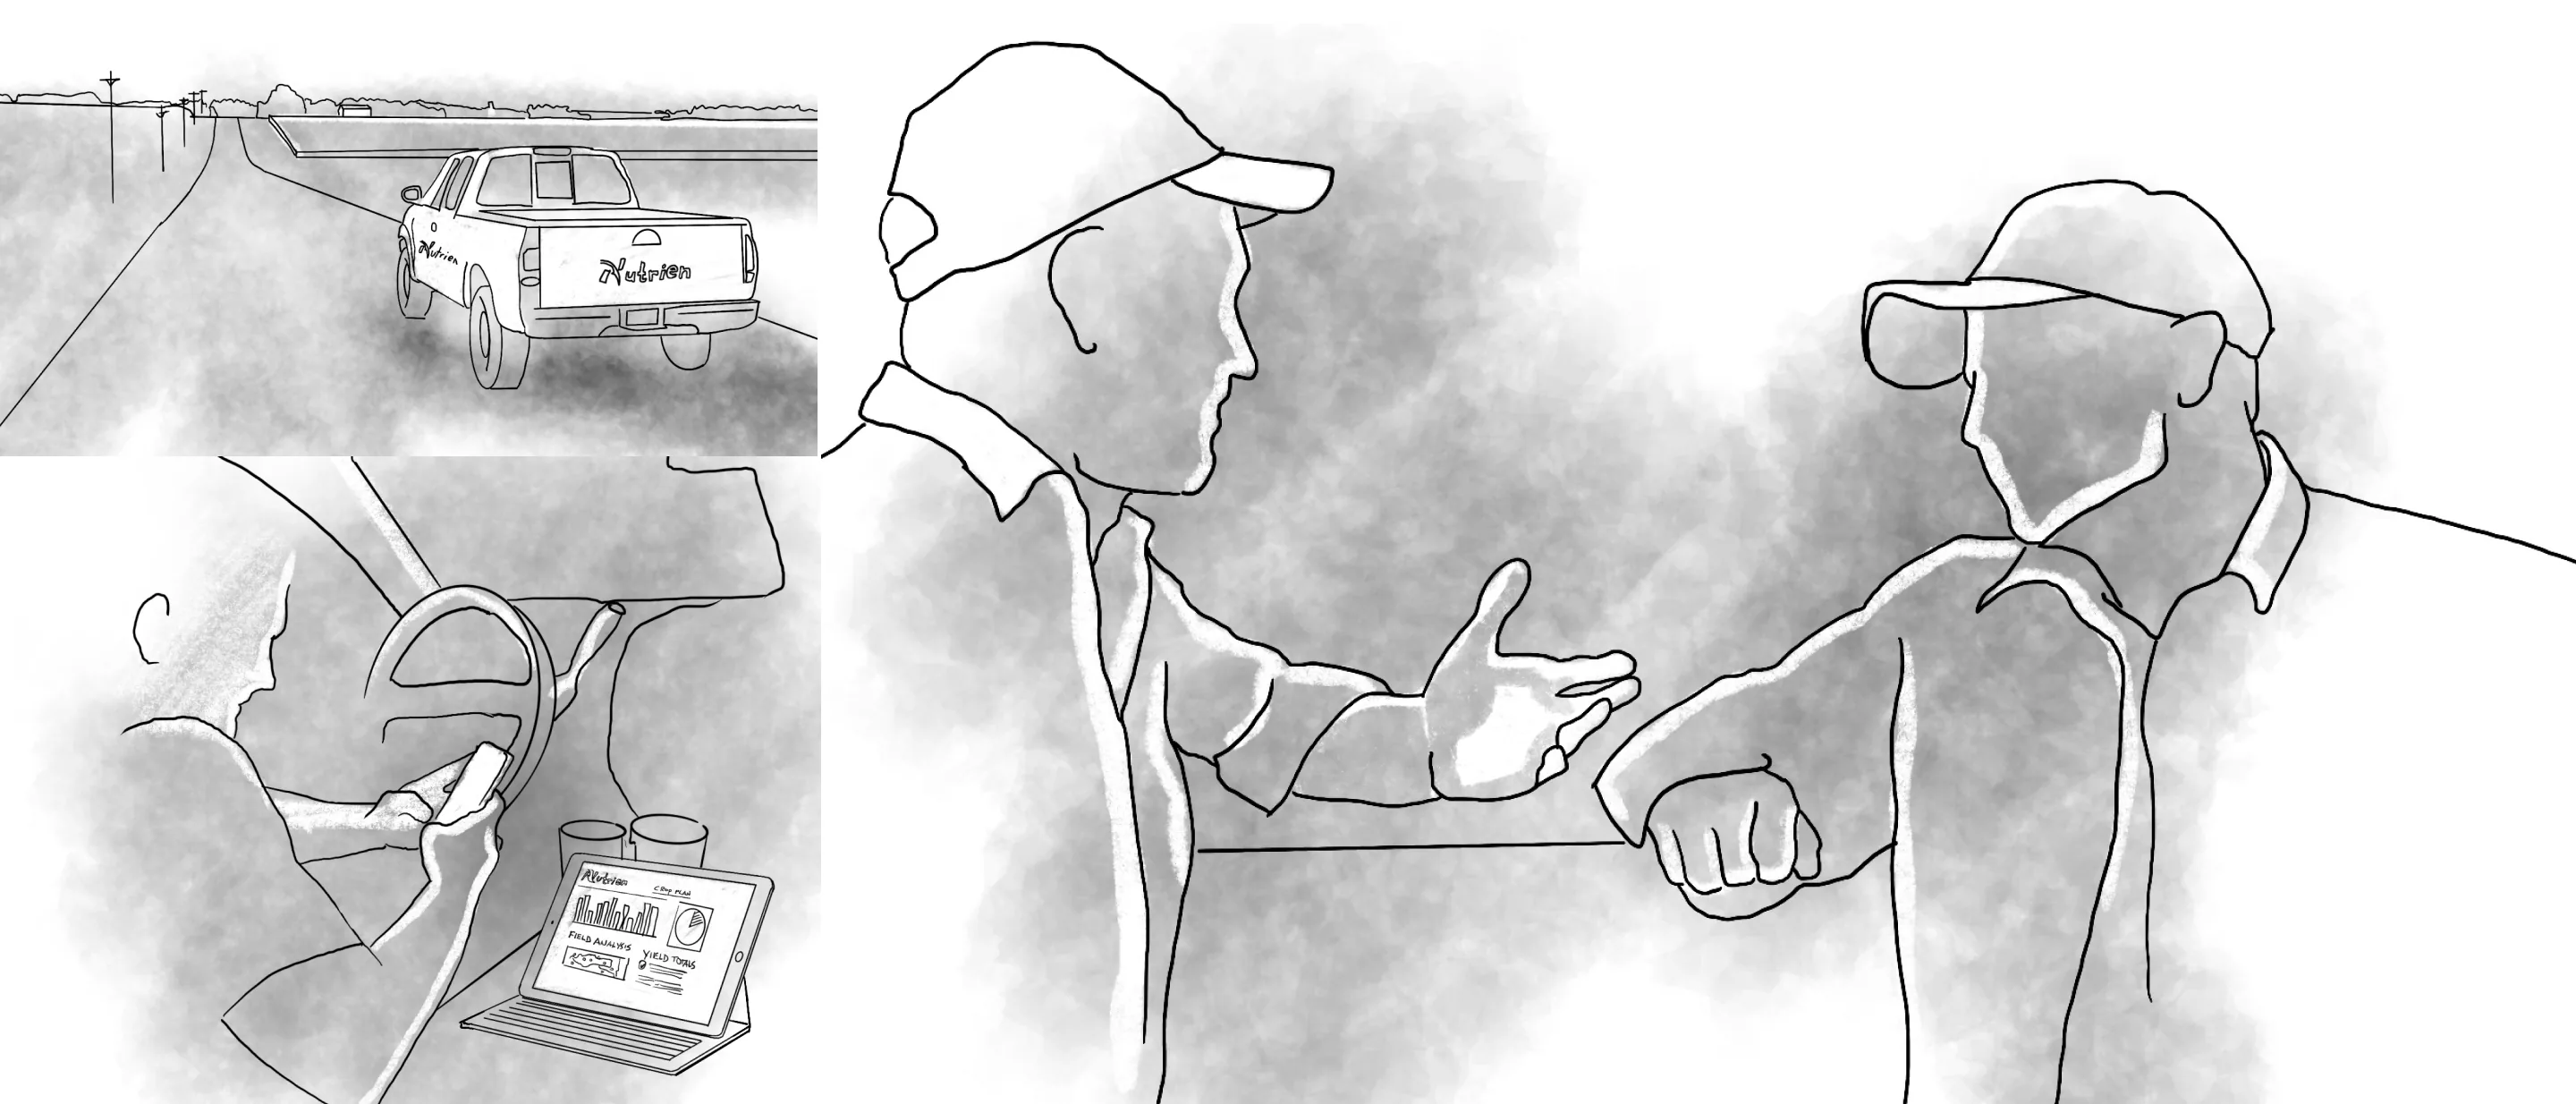
Storyboard: a crop consultant’s day
After a trip into the field I am always eager to share what I learned with my team. I find that storyboards are a great way to summarize learnings in a way that is memorable.
AI and Machine Learning
As one of the world’s largest ag companies, Nutrien had one of the largest sets of farming data in existence. The challenge was that it was offline and inaccessible. To activate this treasure trove of insight I led the design of a Machine Learning initiative. The backend of the system was an engine called Deep Green that mined data looking for sales opportunities that our busy consultants might miss. Inside our tools, these recommendations were served up by a system named Max.
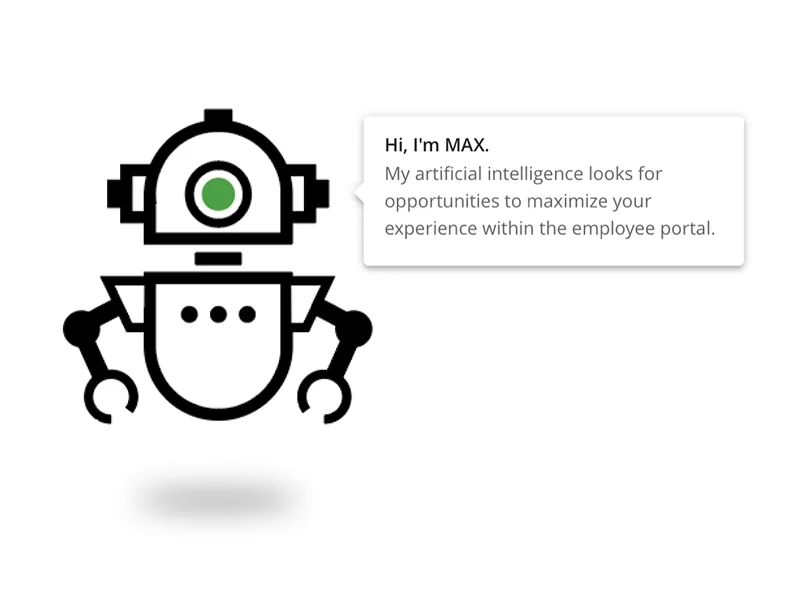
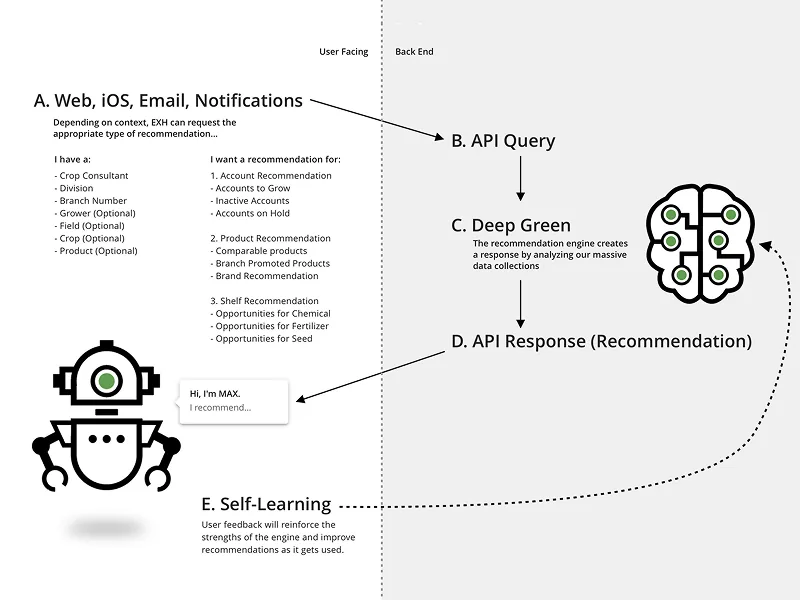
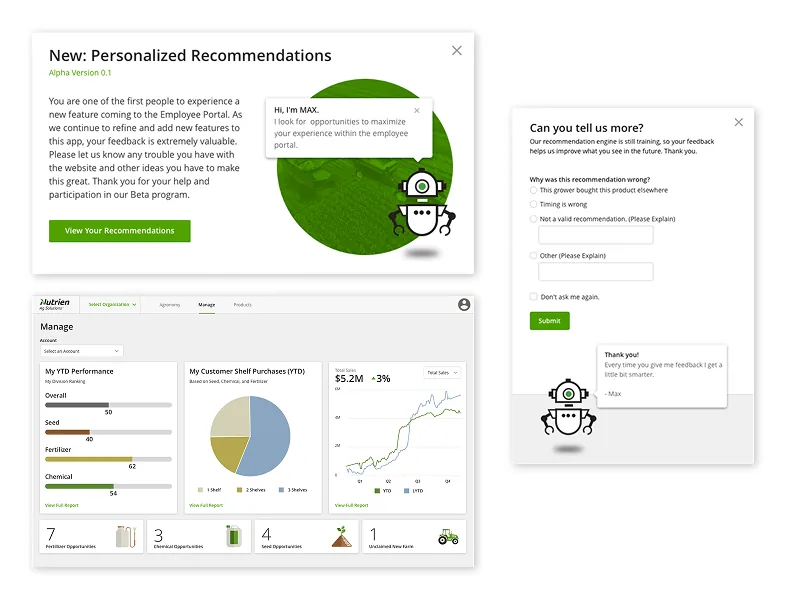
This work was done in the years right before the AI explosion and set me up nicely for the next wave of UX design where chatting with a bot would become commonplace. One of the learnings from my testing with Max was how important trust is to users. I remember one of the crop consultants whose feedback after seeing a recommendation from our system was, “Agriculture is a lot more difficult than an algorithm thinks.” Trusting an AI that occasionally produces a bad recommendation is exactly the problem that LLMs are still wrestling with today.